Fig. 4.
Download original image
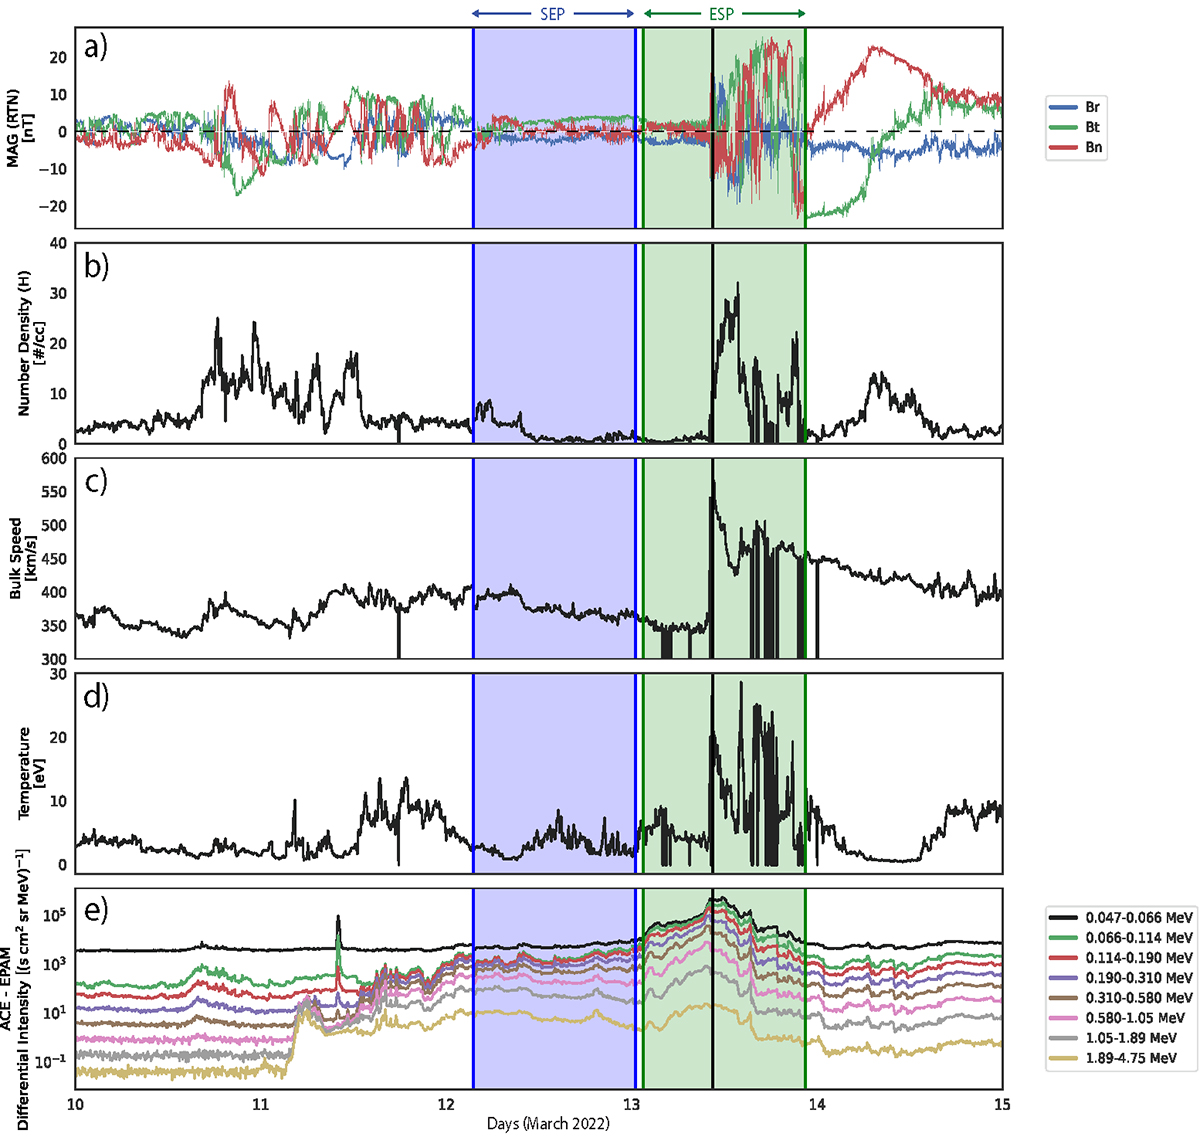
Overview of the ACE measurements of the event. Panel (a): Magnetic field vector, with coordinates shown in the upper right corner. Panels (b)–(d): solar wind ion (proton) number density (b), bulk speed (c), and temperature (d). Panel (e): Ion flux, with the energy bins shown on the upper left corner. The blue, green, and black lines once again show the gradual SEP phase (from 2022 March 12 at 03:29:33 to 2022 March 13 at 00:30:33), ESP phase (from 2022 March 13 at 01:30:02 to 22:29:43), and passage of the IP shock (2022 March 13 at 10:29:51), respectively.
Current usage metrics show cumulative count of Article Views (full-text article views including HTML views, PDF and ePub downloads, according to the available data) and Abstracts Views on Vision4Press platform.
Data correspond to usage on the plateform after 2015. The current usage metrics is available 48-96 hours after online publication and is updated daily on week days.
Initial download of the metrics may take a while.