Fig. 1.
Download original image
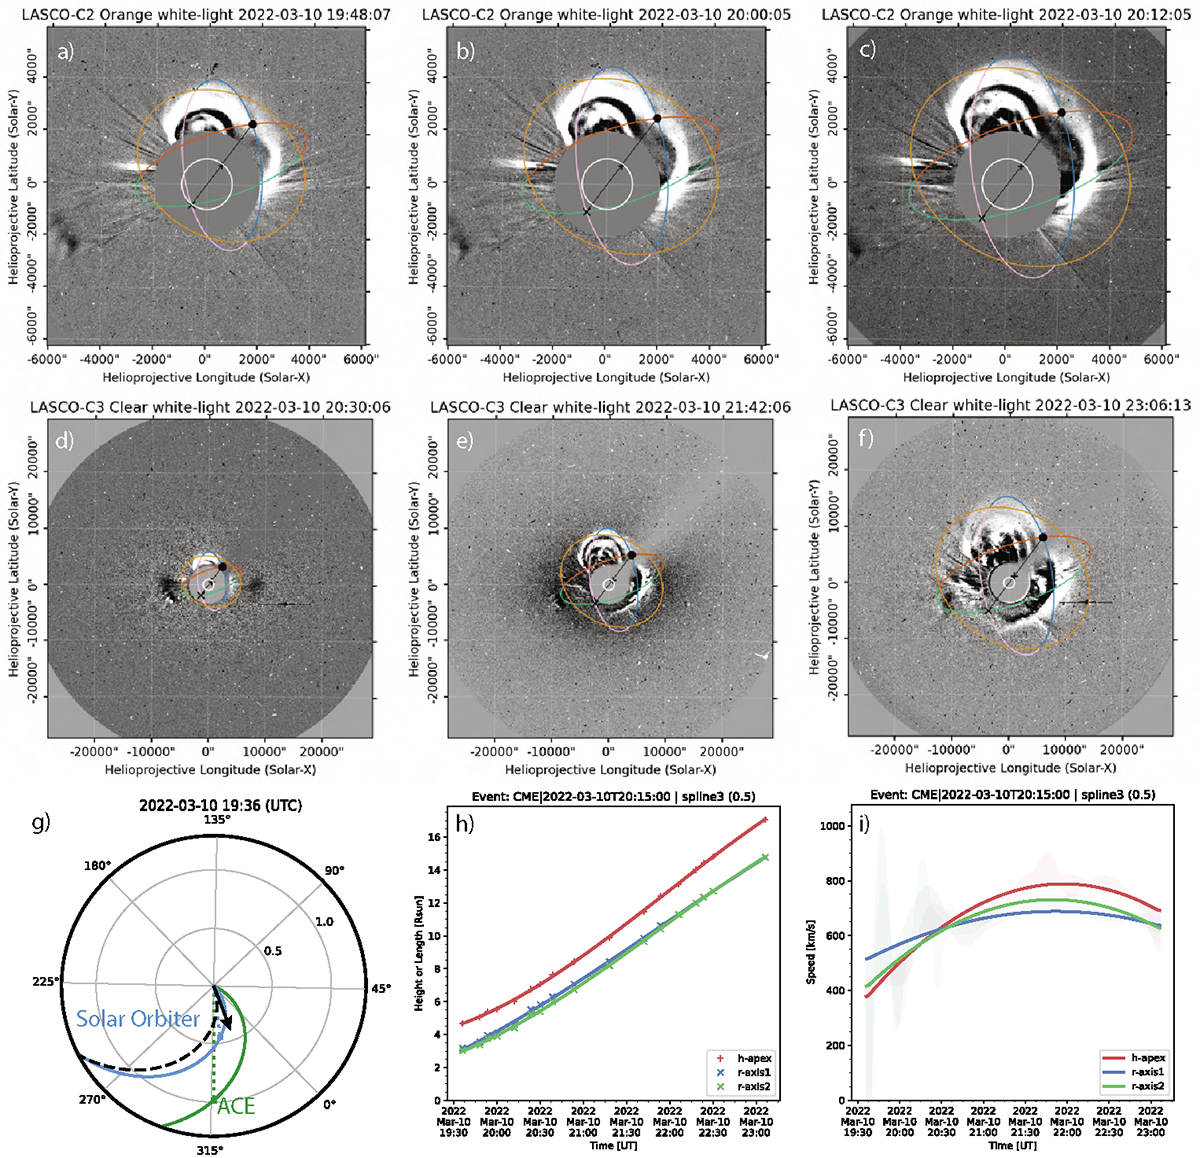
Reconstruction of the 2022 March 10 CME-driven shock. Panels (a)–(f): Images from LASCO-C2 and LASCO-C3 depicting the evolution of the CME. These images also show the reconstructed shock wave calculated using an ellipsoidal model (orange lines) via the PyThea code package Kouloumvakos et al. (2022). Panel (g): Relative positions of Solar Orbiter and ACE in Carrington coordinates during the initial stages of the event, shown in a view of the ecliptic plane from the ecliptic north, produced using the Solar-MACH tool (Gieseler et al. 2023). The arrow denotes the direction of the CME-driven shock nose expansion computed from PyThea. Panels (h) and (i): Computed kinematic properties (height and speed) of the reconstructed shock wave from PyThea.
Current usage metrics show cumulative count of Article Views (full-text article views including HTML views, PDF and ePub downloads, according to the available data) and Abstracts Views on Vision4Press platform.
Data correspond to usage on the plateform after 2015. The current usage metrics is available 48-96 hours after online publication and is updated daily on week days.
Initial download of the metrics may take a while.