Fig. 4.
Download original image
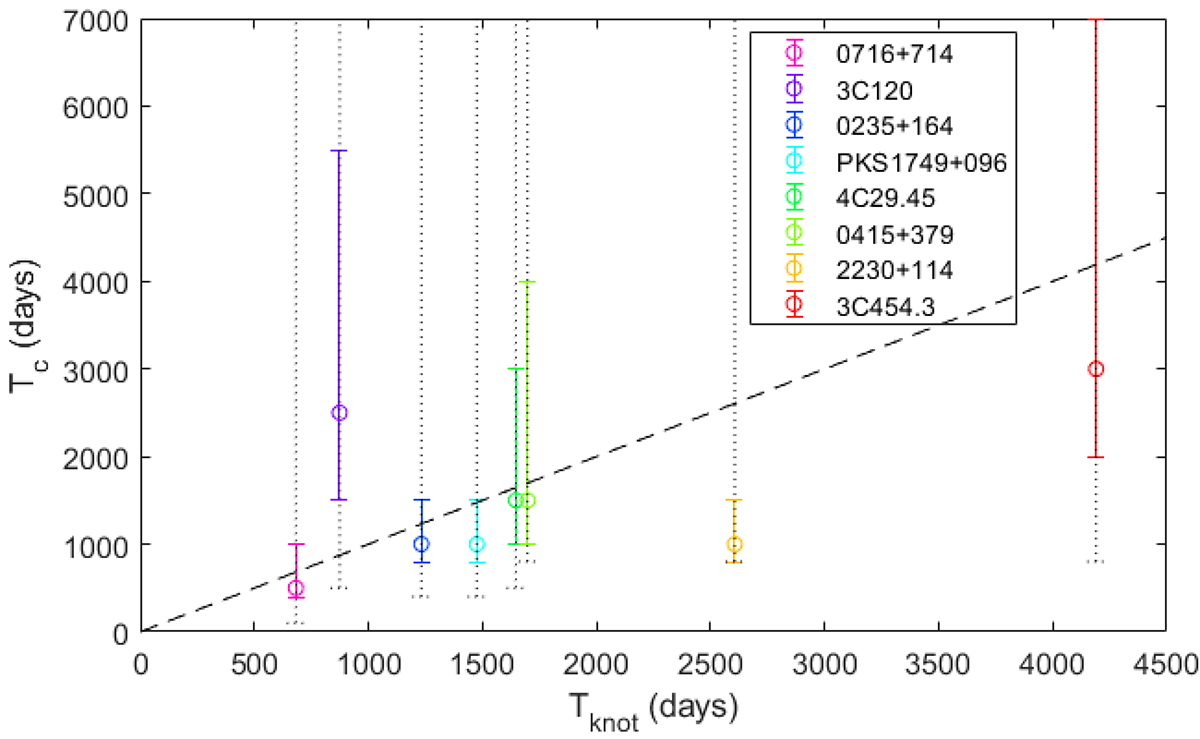
Scatter plot showing the results from Table 1. The knot timescale is on the x-axis and the characteristic timescale on the y-axis. The coloured error bars are based on the 90% characteristic timescale confidence regions associated with the best-fit slope β obtained from the best bending power-law fit. The grey error bars are the confidence regions of the timescale when the slope is allowed to vary. For each source, except 2230+114, the knot timescale and characteristic timescale associated with the fixed best-fit slope β are consistent within uncertainties given the sparse parameter grid.
Current usage metrics show cumulative count of Article Views (full-text article views including HTML views, PDF and ePub downloads, according to the available data) and Abstracts Views on Vision4Press platform.
Data correspond to usage on the plateform after 2015. The current usage metrics is available 48-96 hours after online publication and is updated daily on week days.
Initial download of the metrics may take a while.