Fig. 8
Download original image
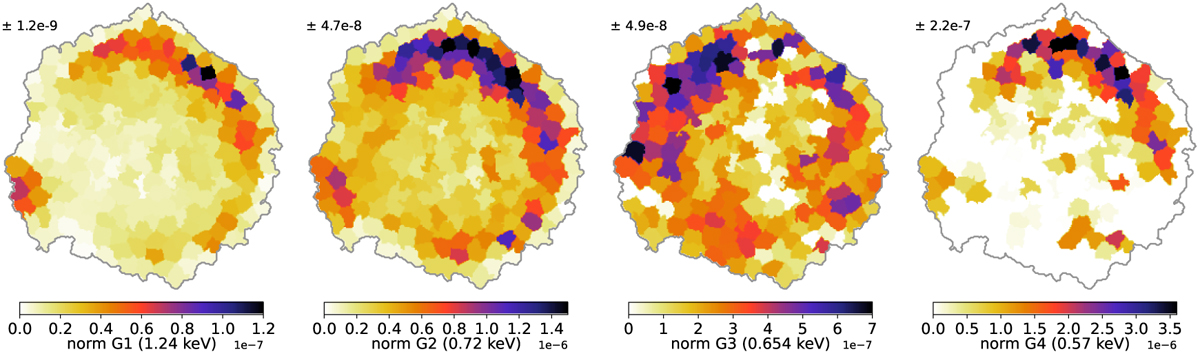
Maps of the normalisation, divided by the surface of each region, of the four Gaussians added to the model: G1 at 1.24 keV, G2 at 0.72 keV, G3 at 0.654 keV and G4 at 0.57 keV. The scales are not the same. While G1, G2 and G4 seem correlated with the IME and iron components, the spatial distribution of G3 is very different and is likely associated with O VIII. This would represent the first detection and mapping of oxygen emission in Tycho’s SNR.
Current usage metrics show cumulative count of Article Views (full-text article views including HTML views, PDF and ePub downloads, according to the available data) and Abstracts Views on Vision4Press platform.
Data correspond to usage on the plateform after 2015. The current usage metrics is available 48-96 hours after online publication and is updated daily on week days.
Initial download of the metrics may take a while.