Open Access
Fig. D.1
Download original image
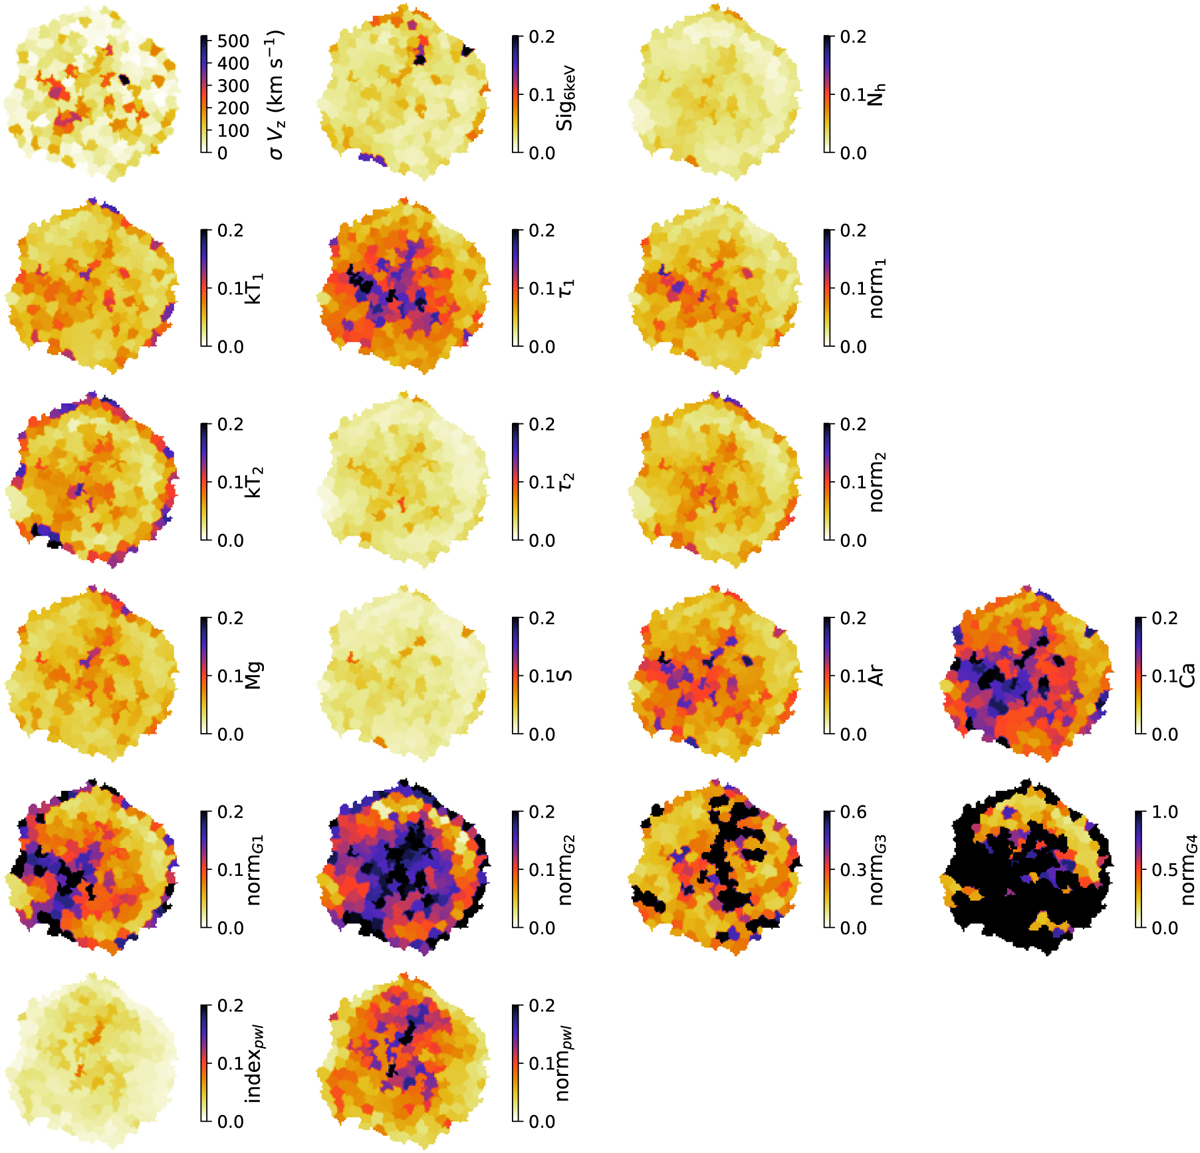
Maps of relative errors for the 19 parameters fitted in this study. The error maps in this figure follow the order of the parameter maps in this article. We note that for the velocity, we plot the absolute error (more relevant) instead. The norms of G3 and G4 do not share the same color scaling as the other parameters.
Current usage metrics show cumulative count of Article Views (full-text article views including HTML views, PDF and ePub downloads, according to the available data) and Abstracts Views on Vision4Press platform.
Data correspond to usage on the plateform after 2015. The current usage metrics is available 48-96 hours after online publication and is updated daily on week days.
Initial download of the metrics may take a while.