Open Access
Fig. C.2
Download original image
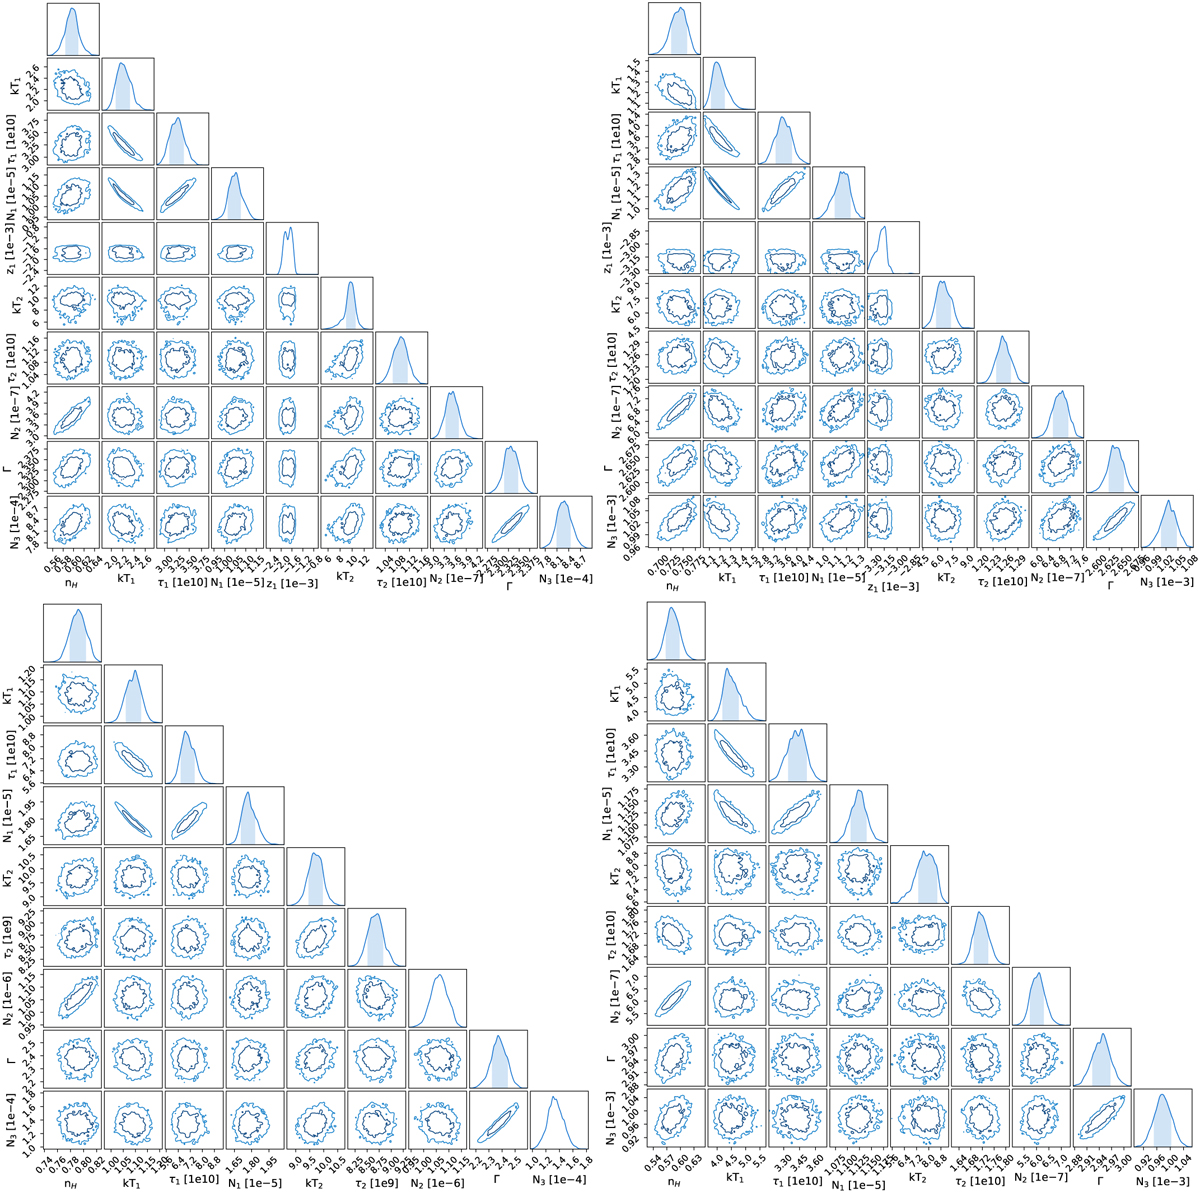
Four other examples of posterior distribution of the regions 89 (top left), 99 (top right), 174 (bottom left), and 184 (bottom right), whose spectra are shown in Fig. 2. The number of parameters is reduced here only for visualisation, the posterior projections not shown here are also well constrained.
Current usage metrics show cumulative count of Article Views (full-text article views including HTML views, PDF and ePub downloads, according to the available data) and Abstracts Views on Vision4Press platform.
Data correspond to usage on the plateform after 2015. The current usage metrics is available 48-96 hours after online publication and is updated daily on week days.
Initial download of the metrics may take a while.