Fig. 11
Download original image
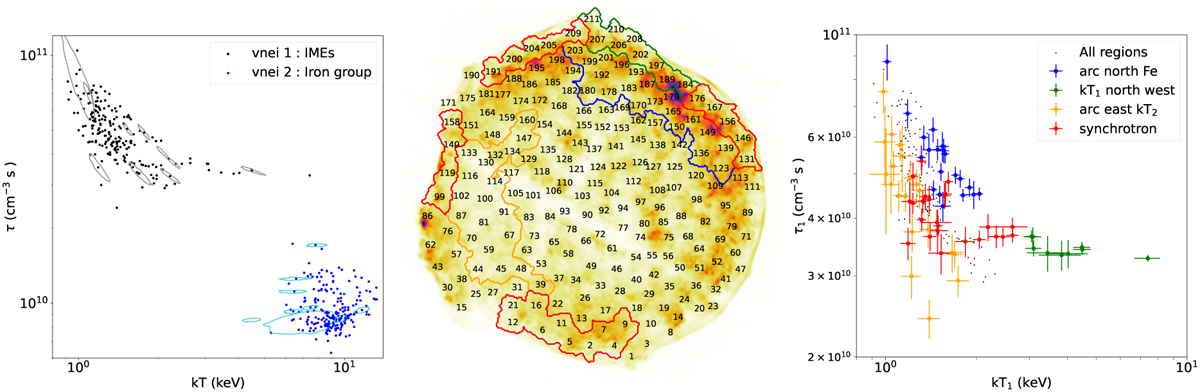
Correlation over the entire SNR between the temperature kT and ionisation time τ. Left panel: this correlation for the IME thermal component (in black) and iron-rich thermal component (in blue). We add the contours of uncertainty at 1 sigma for the nine example regions (spectra in Fig. 2). Middle panel: clusters of regions with different physical properties (see text in Sect. 5.2) superimposed on the flux map between 0.5 and 7 keV. Right panel: correlation between the temperature and ionisation time of the IME thermal component for specific regions (coded with different colors for each cluster). The error bars are the standard deviations of the posterior distributions for each region.
Current usage metrics show cumulative count of Article Views (full-text article views including HTML views, PDF and ePub downloads, according to the available data) and Abstracts Views on Vision4Press platform.
Data correspond to usage on the plateform after 2015. The current usage metrics is available 48-96 hours after online publication and is updated daily on week days.
Initial download of the metrics may take a while.