Fig. 10
Download original image
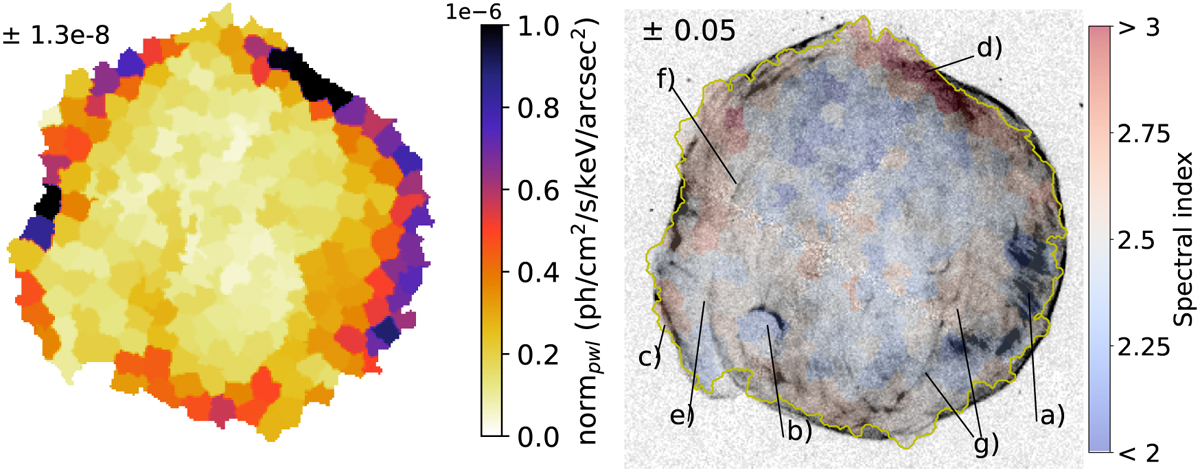
Obtained maps related to the non-thermal emission. Left: map of the norm of the power law component. Right: map of the photon index of the power law component in color overlaid on the map of the emission between 4 and 6 keV, associated with the synchrotron emission. The background image is corrected from the exposure map. The yellow line traces the outer contour of the ejecta and our regions (see Fig. 1). Some features are highlighted and described in the text (Sect. 4.7).
Current usage metrics show cumulative count of Article Views (full-text article views including HTML views, PDF and ePub downloads, according to the available data) and Abstracts Views on Vision4Press platform.
Data correspond to usage on the plateform after 2015. The current usage metrics is available 48-96 hours after online publication and is updated daily on week days.
Initial download of the metrics may take a while.