Fig. 9
Download original image
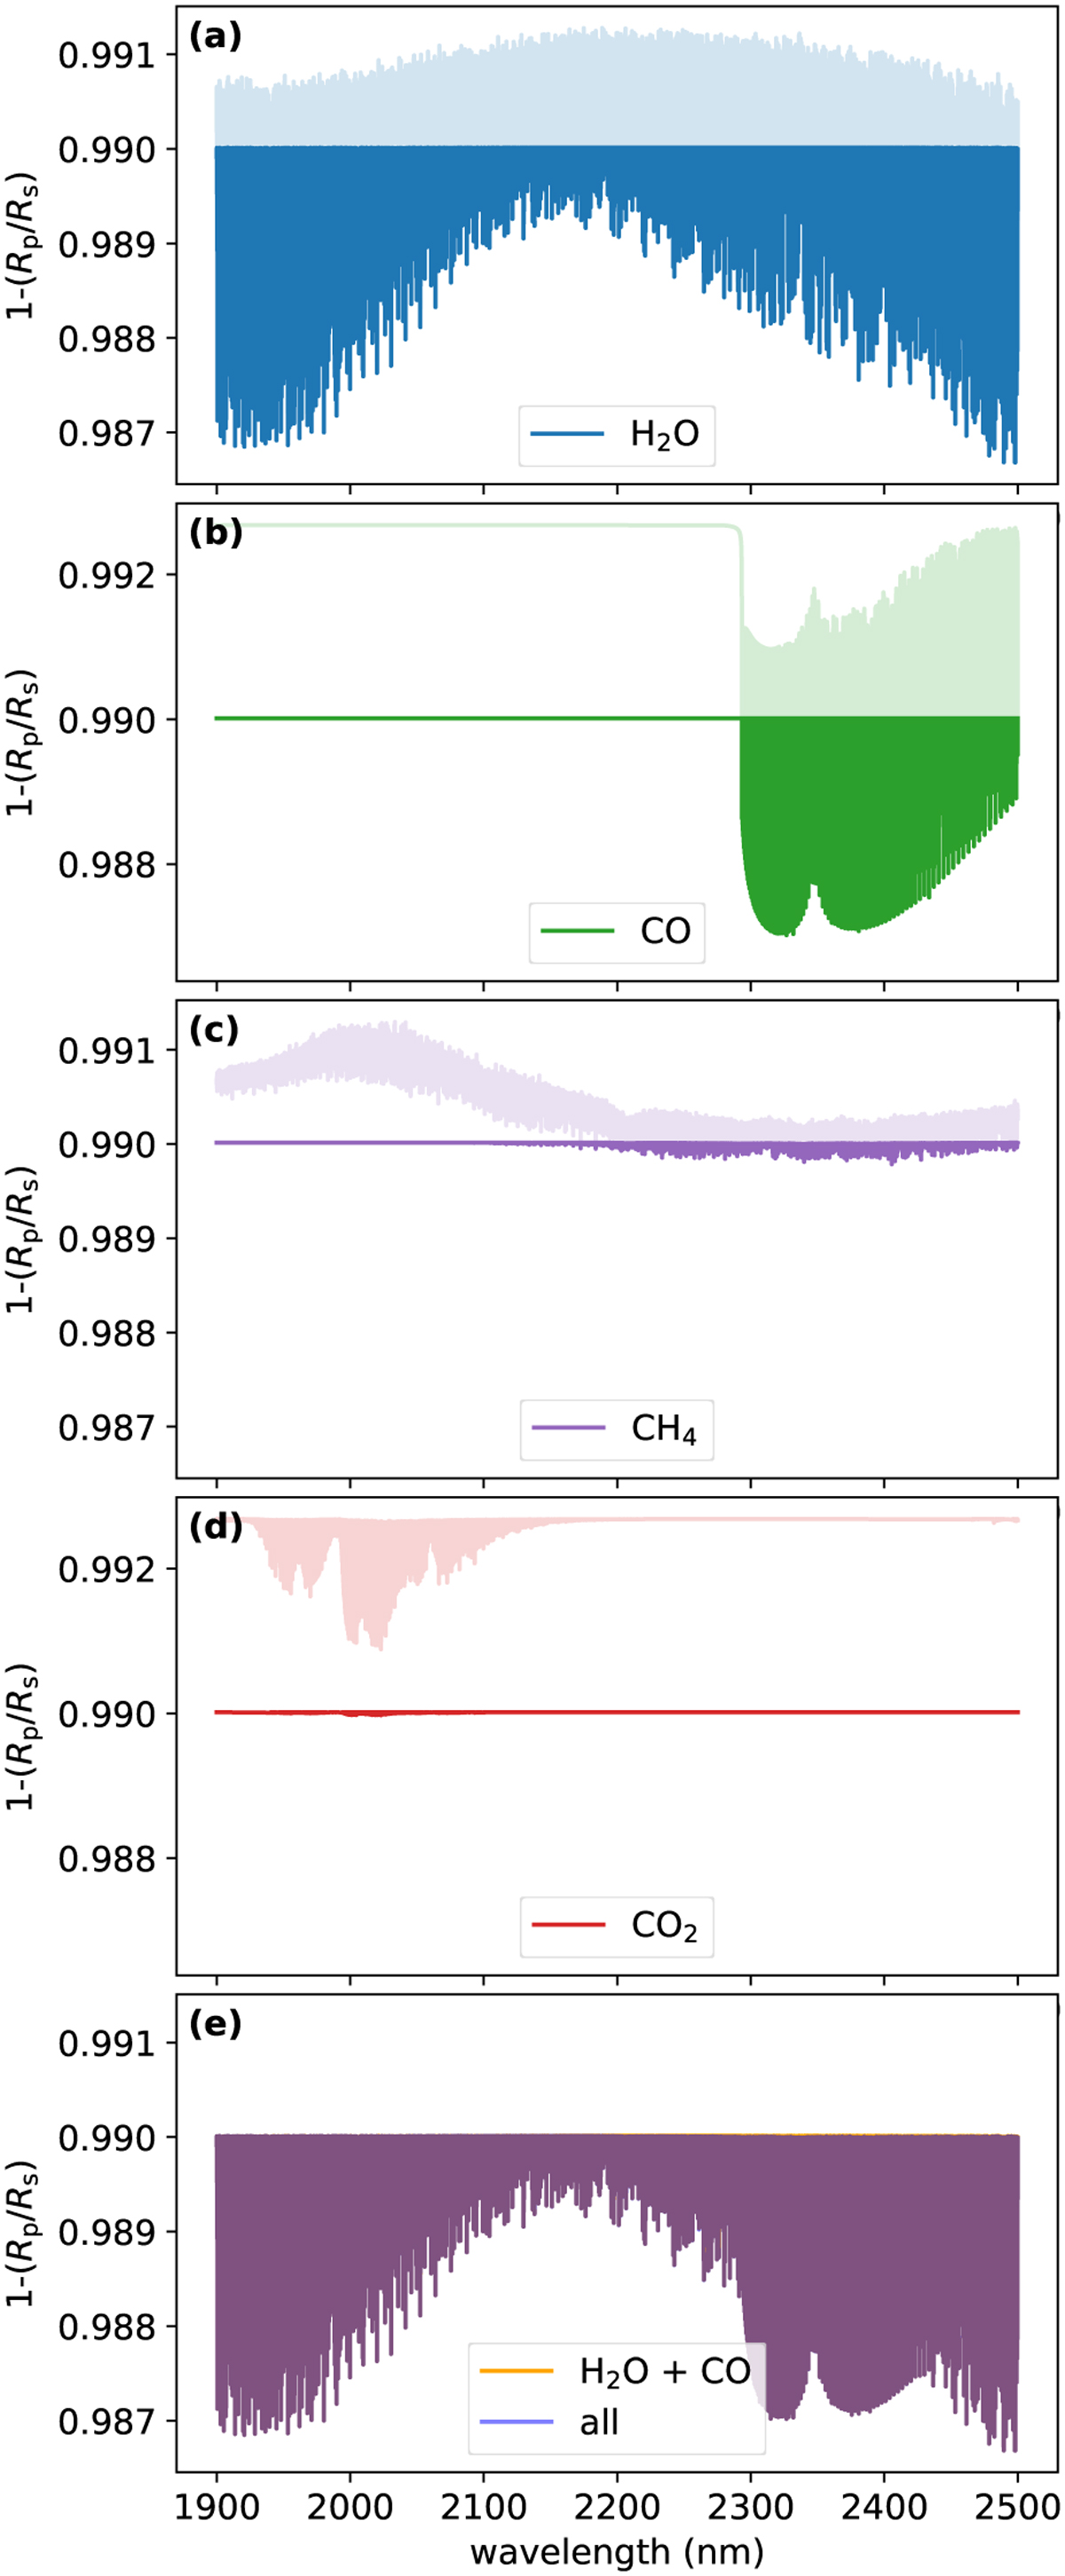
Example transmission spectra for all probed species. Panel a shows water, panel b carbon monoxide, panel c methane, and panel d carbon dioxide. The lighter shaded regions indicate the features that would be visible without the cloud deck, the darker shaded regions represent the features visible despite the cloud deck. Here we use the isothermal temperature and cloud top pressure retrieved for the blueshifted signal. Panel e shows a model containing all four species plotted in light shaded blue over a model containing only H2O+CO solid in orange. As both spectra are identical the resulting plot emerges as purple. Any deviation between the two models would show up as either only orange or only blue. This illustrates that methane and carbon dioxide, if present at abundances consistent with equilibrium chemistry, will not alter the spectrum with respect to a H2O+CO only model. This is due to their features being hidden below the continuum, which in turn is given by the water absorption and the cloud deck.
Current usage metrics show cumulative count of Article Views (full-text article views including HTML views, PDF and ePub downloads, according to the available data) and Abstracts Views on Vision4Press platform.
Data correspond to usage on the plateform after 2015. The current usage metrics is available 48-96 hours after online publication and is updated daily on week days.
Initial download of the metrics may take a while.