Fig. 6
Download original image
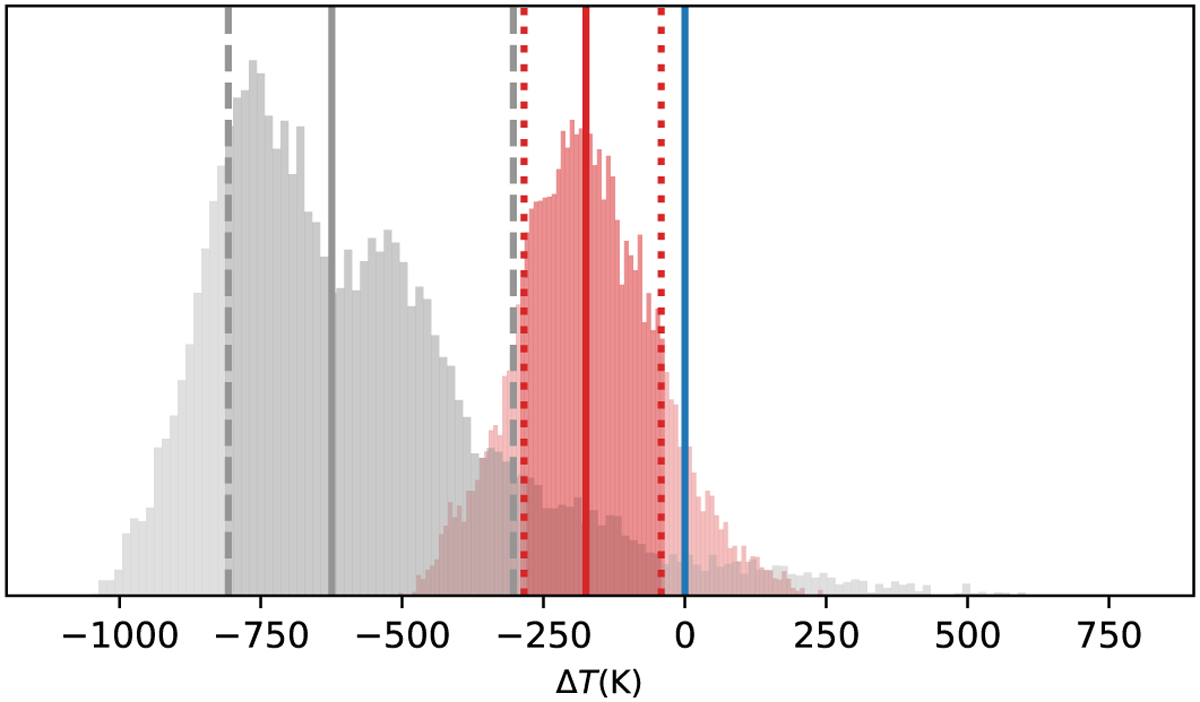
Histogram of the differential temperature distributions. In red we show the distribution of the temperature difference of the red- shifted region to the blueshifted region ∆Tred = Tr − Tb. In grey we show the temperature difference of the polar regions with respect to the blueshifted region ∆Tpole = Tp – Tb. The red and grey solid lines indicate the median of the respective distributions. The blue solid line indicates the zero point as the position of the relative temperature of the blueshifted region. The regions between the 16 and 84th percentiles, indicative of the 1σ uncertainties of each of the two distributions, are indicated in deeper colours and additionally by dashed grey and dotted red lines for the pole and redshifted distributions, respectively. The corresponding values are ![]() and
and ![]() . While both distributions overlap, their peaks are distinct from each other and distinct from zero by approximately 1 and 1.9σ, respectively.
. While both distributions overlap, their peaks are distinct from each other and distinct from zero by approximately 1 and 1.9σ, respectively.
Current usage metrics show cumulative count of Article Views (full-text article views including HTML views, PDF and ePub downloads, according to the available data) and Abstracts Views on Vision4Press platform.
Data correspond to usage on the plateform after 2015. The current usage metrics is available 48-96 hours after online publication and is updated daily on week days.
Initial download of the metrics may take a while.