Fig. 5
Download original image
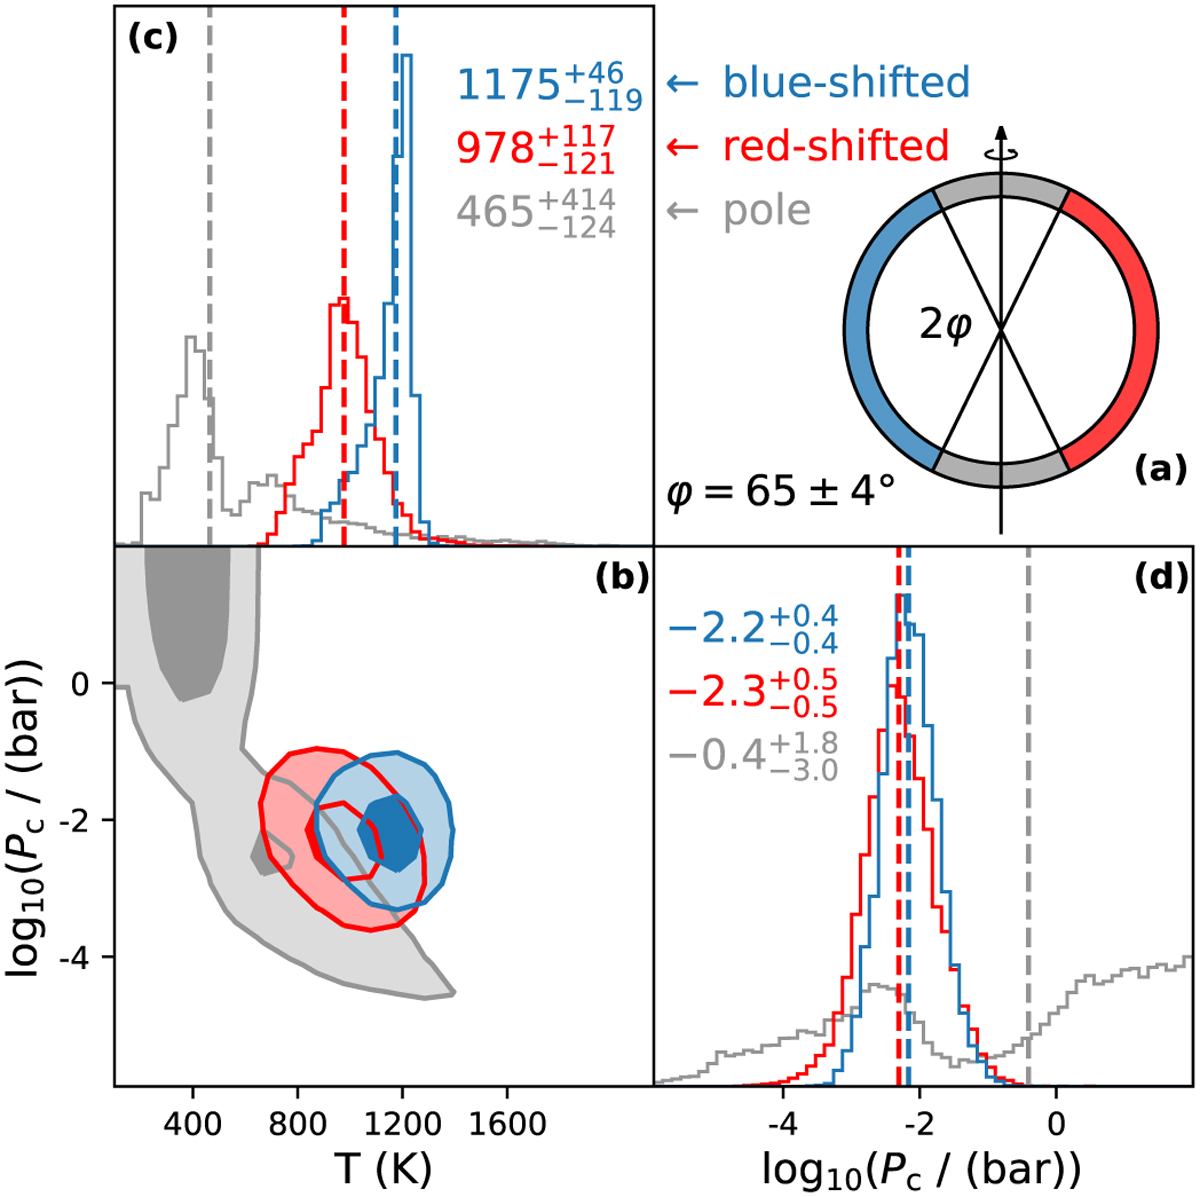
Atmospheric properties of the three different modelled regions of the planet. Panel a: sketch of the three different regions retrieved for the planet atmosphere. Panel b: probability distributions of the temperature and cloud top pressure retrieved for the three regions. The isolines indicate the 1 and 2σ levels of a 2D distribution, i.e. encompassing 39.3 and 86.0% of all posterior samples, respectively. The blueshifted terminator region is indicated in blue, the redshifted terminator region is indicated in red, and the polar region is indicated in grey. Panel c: histograms of the temperature distributions. Panel d: histograms of the cloud top pressure distributions. The mean values of the distributions are indicated with a dashed line. The respective values are quoted in the plot, together with the 1σ uncertainties of a 1D distribution, i.e. determined as the values that encompass 68.0% of the distribution.
Current usage metrics show cumulative count of Article Views (full-text article views including HTML views, PDF and ePub downloads, according to the available data) and Abstracts Views on Vision4Press platform.
Data correspond to usage on the plateform after 2015. The current usage metrics is available 48-96 hours after online publication and is updated daily on week days.
Initial download of the metrics may take a while.