Fig. 3
Download original image
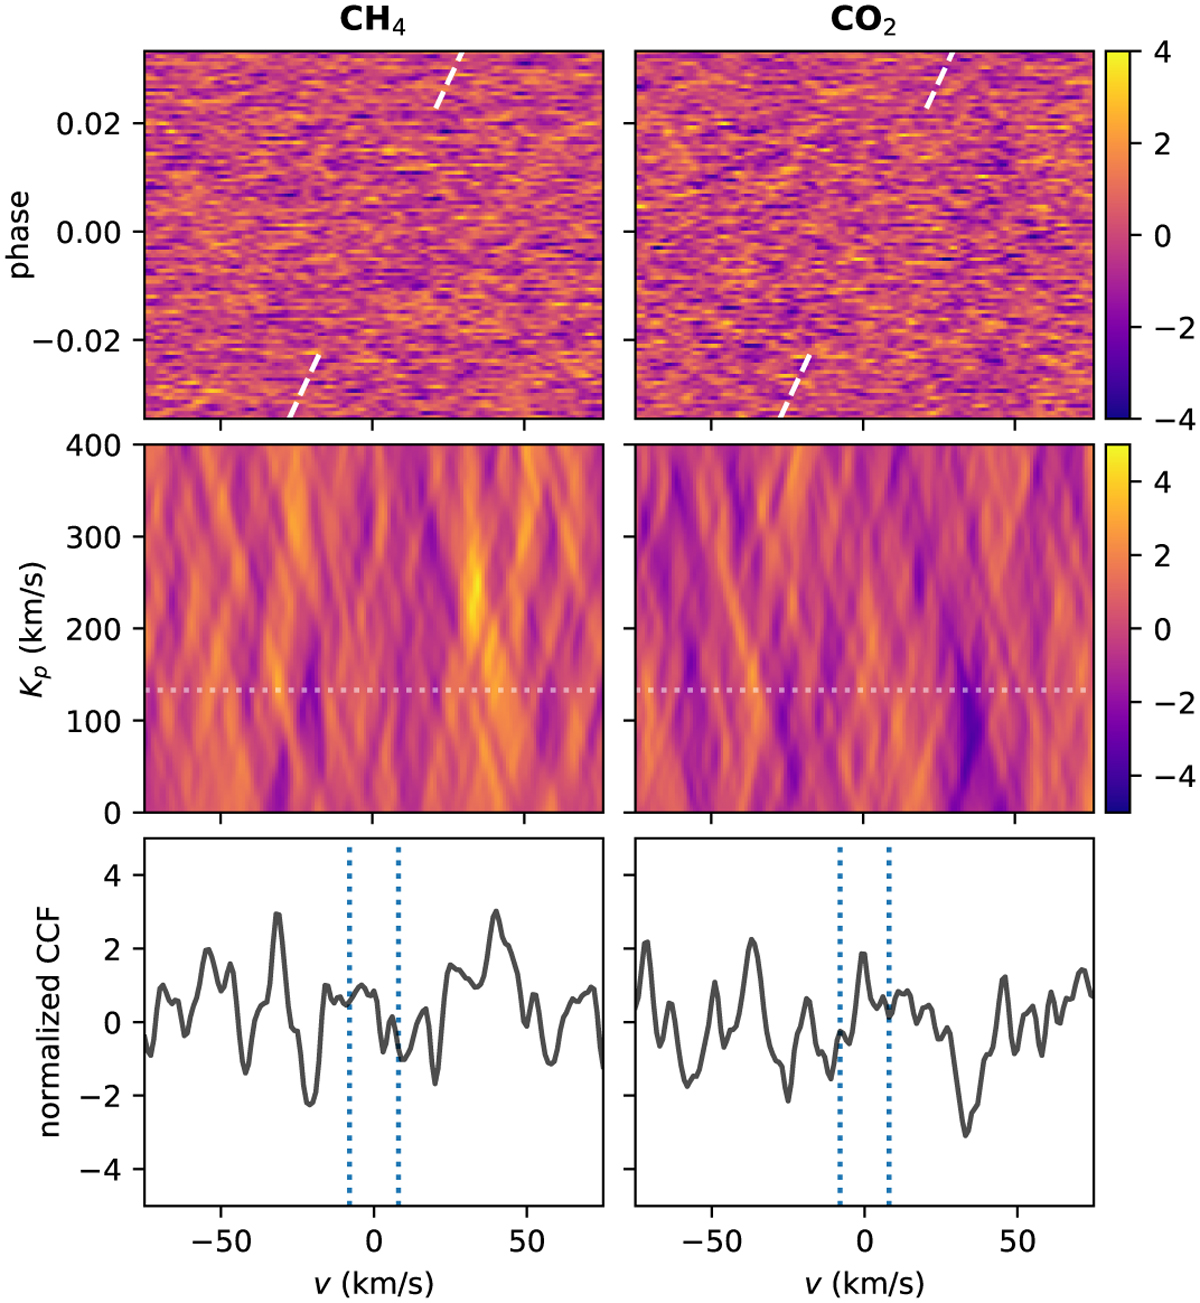
Results of the cross-correlation analysis for methane (CH4, left column) and carbon dioxide (CO2, right column). The results shown are based on data corrected by using SYSREM in telluric rest frame. Top panels: cross-correlation function for each orbital phase. Middle panels: Kp-v maps. Bottom panels: cut through the Kp-v map at the literature Kp value.
Current usage metrics show cumulative count of Article Views (full-text article views including HTML views, PDF and ePub downloads, according to the available data) and Abstracts Views on Vision4Press platform.
Data correspond to usage on the plateform after 2015. The current usage metrics is available 48-96 hours after online publication and is updated daily on week days.
Initial download of the metrics may take a while.