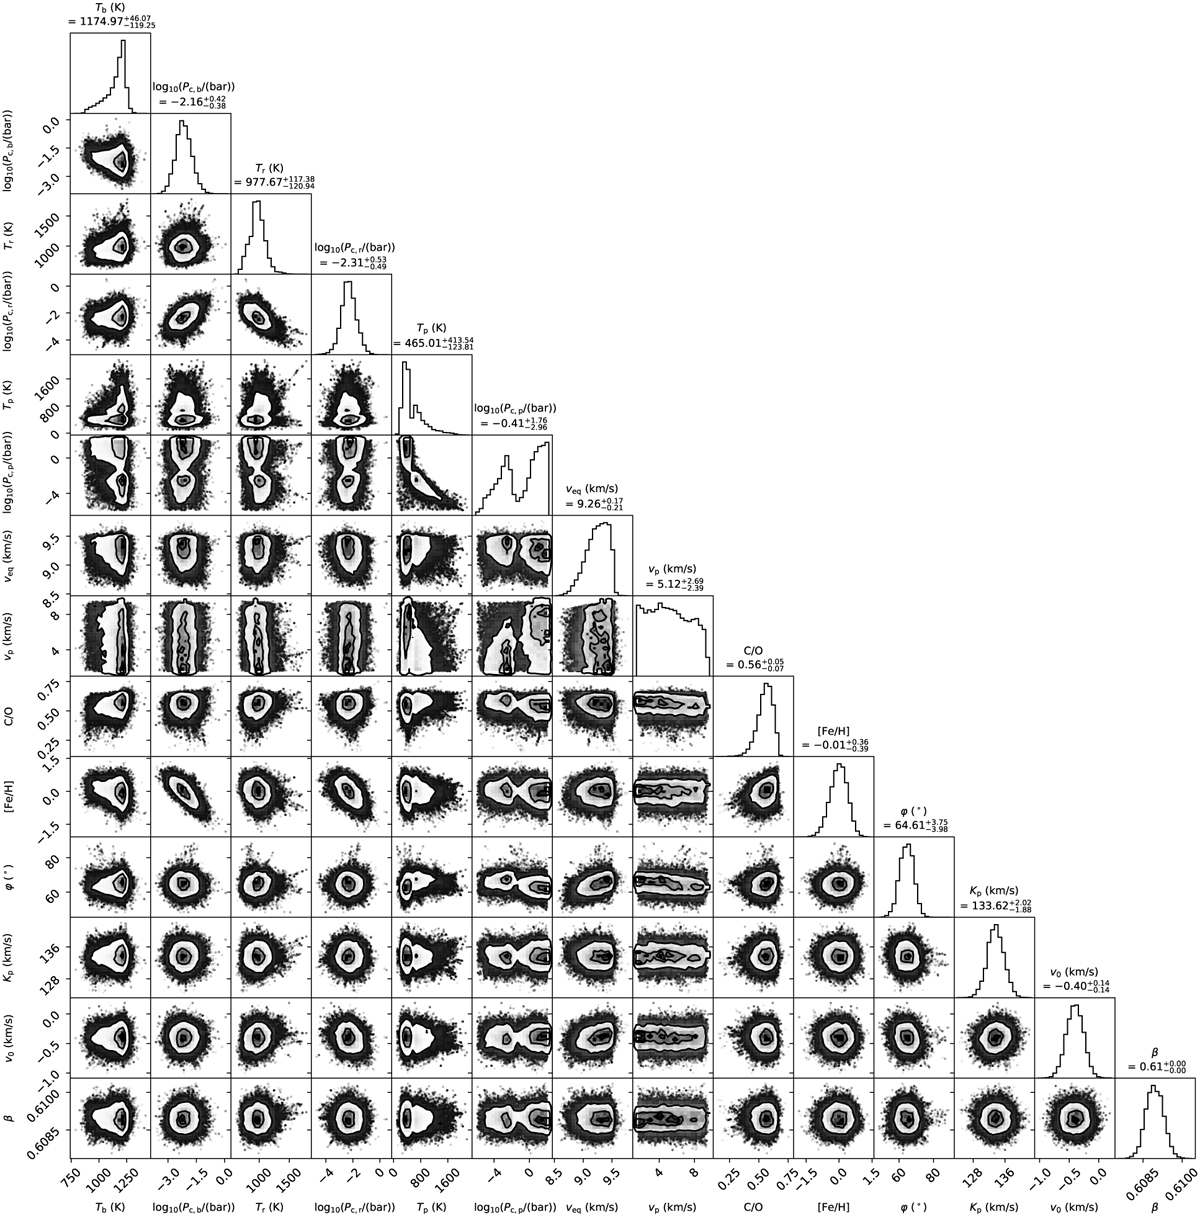
Fig. B.1
Download original image
Results of the retrieval. The first six distributions represent the isothermal temperatures T and cloud top pressures log10(Pc) of the three independently modelled atmospheric regions (index b stands for the blueshifted signal, r for the redshifted signal and p for the polar regions). These values are followed by the distributions for the maximal velocity at the equatorial regions (weq) and the one for the polar regions (vp). The last six distributions are showing the shared atmospheric parameters C/O ratio and metallicity [Fe/H], the latitudinal angle that separates the equatorial jet from the poles φ, the system parameters Kp and v0, as well as a noise scaling factor β.
Current usage metrics show cumulative count of Article Views (full-text article views including HTML views, PDF and ePub downloads, according to the available data) and Abstracts Views on Vision4Press platform.
Data correspond to usage on the plateform after 2015. The current usage metrics is available 48-96 hours after online publication and is updated daily on week days.
Initial download of the metrics may take a while.