Fig. A.3
Download original image
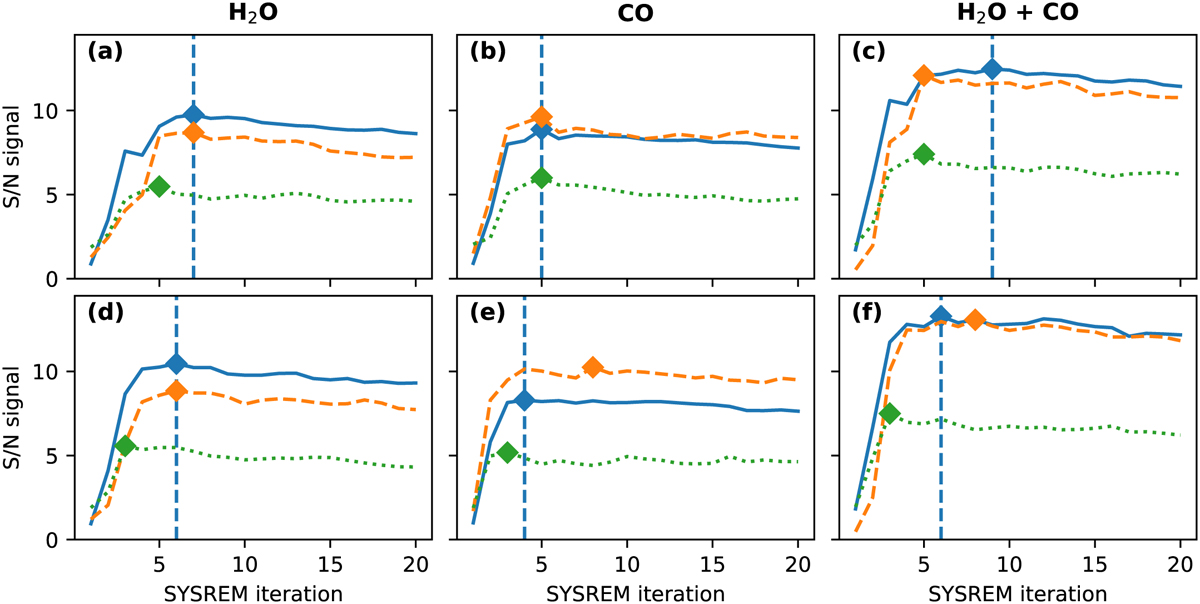
Determination of the best SYSREM iteration. Shown is the progression of the S/N of the recovered signal with the number of SYSREM iterations for the injected signal (blue solid line), the blueshifted signal (orange dashed line), and the redshifted signal (green dotted line). Panels a, b and c show the values for SYSREM performed in (quasi-)stellar rest frame, leading to the results shown in Fig. 2. Panels d, e and f show the values for SYSREM performed in telluric rest frame leading to the results shown in Fig. A.2. In all cases the diamonds indicate the peak signal position.
Current usage metrics show cumulative count of Article Views (full-text article views including HTML views, PDF and ePub downloads, according to the available data) and Abstracts Views on Vision4Press platform.
Data correspond to usage on the plateform after 2015. The current usage metrics is available 48-96 hours after online publication and is updated daily on week days.
Initial download of the metrics may take a while.