Fig. A.1
Download original image
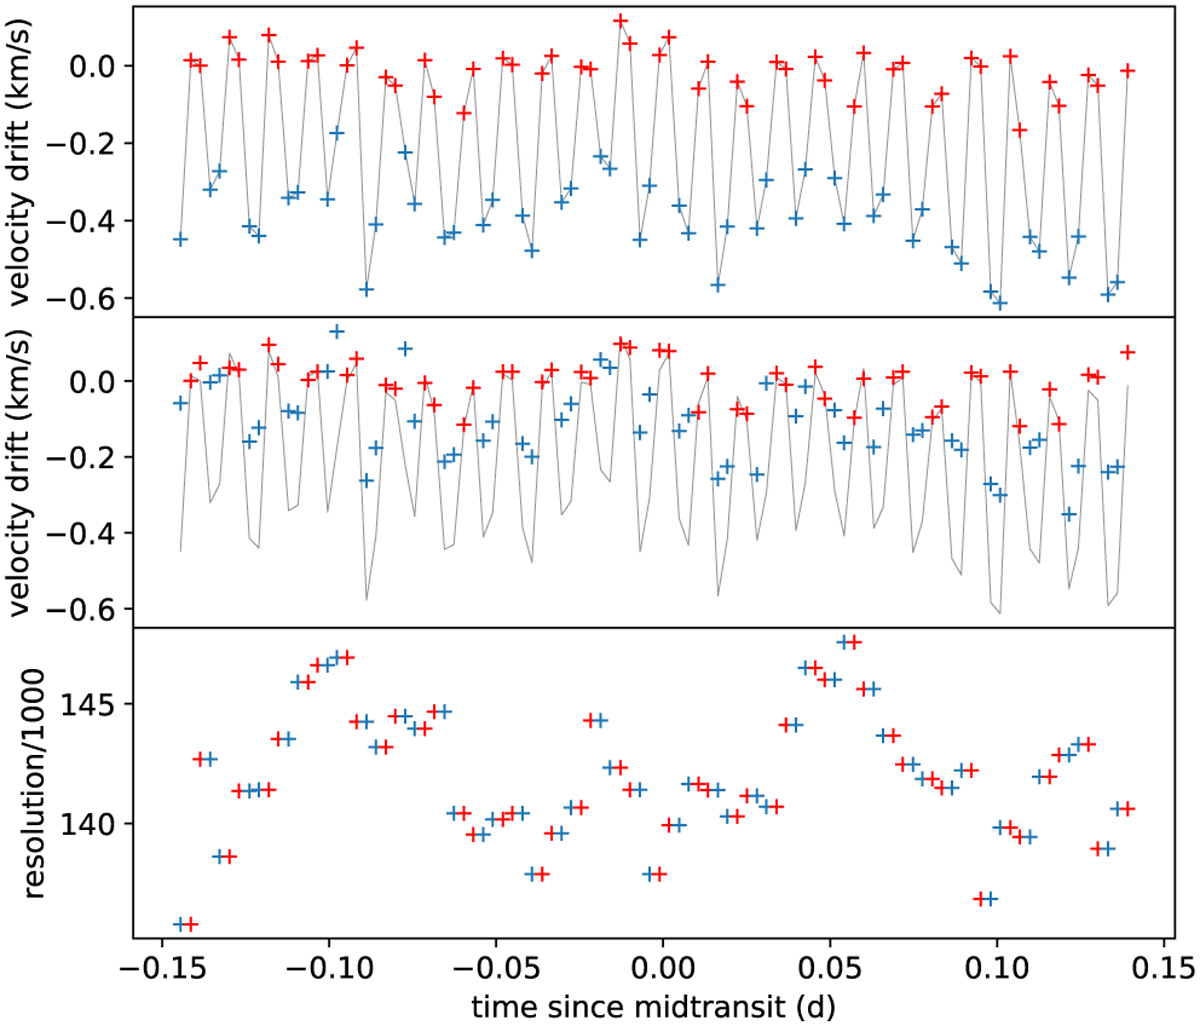
Effects of super-resolution on the resolution and wavelength solution of the observations. Top panel: results from cross-correlation of each spectrum to a reference spectrum (third spectrum of the night, nodding position B) when using the pipeline provided wavelength solution. Position A spectra are plotted in blue, position B spectra in red. Middle panel: same as the top panel but with the wavelength solution derived with molecfit from fitting of telluric lines, for one reference A and one reference B spectrum (third and fourth spectrum of the night). The previous offset is indicated by the black straight line, which is the same as the one shown in panel A. The 0.4 km s−1 offset between A and B has been alleviated, but for both positions a drift over time remains. Bottom panel: mean resolution for each nodding pair from the spatial PSF measurements in each wavelength segment.
Current usage metrics show cumulative count of Article Views (full-text article views including HTML views, PDF and ePub downloads, according to the available data) and Abstracts Views on Vision4Press platform.
Data correspond to usage on the plateform after 2015. The current usage metrics is available 48-96 hours after online publication and is updated daily on week days.
Initial download of the metrics may take a while.