Fig. 1
Download original image
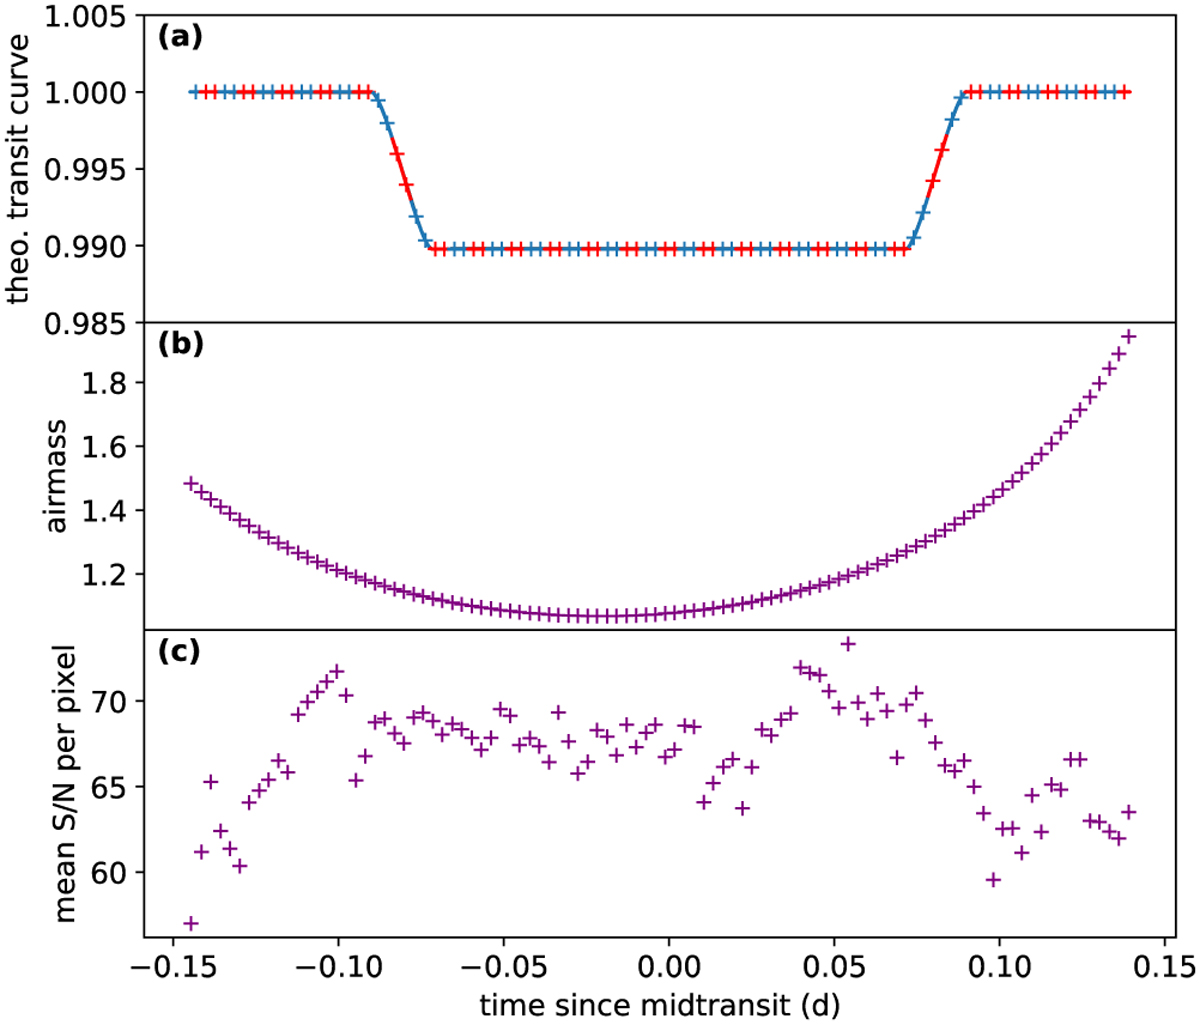
Transit coverage and observing conditions during the observation of WASP-127 b on the night of 24–25 March 2022. Panel a: theoretical light curve based on literature parameters indicating the 98 exposures of 240s. Each data point corresponds to one exposure, and its width to the duration of the exposure. Blue crosses indicate nodding position A and red crosses nodding position B. The transit including ingress and egress (i.e. the first to fourth contact T1–T4) is covered by spectra 20–81; the second to third contact (T2–T3) is covered by spectra 26–75. Panel b: progression of the airmass. Panel c: mean signal-to- noise ratio (S/N) of the spectra over all covered wavelengths.
Current usage metrics show cumulative count of Article Views (full-text article views including HTML views, PDF and ePub downloads, according to the available data) and Abstracts Views on Vision4Press platform.
Data correspond to usage on the plateform after 2015. The current usage metrics is available 48-96 hours after online publication and is updated daily on week days.
Initial download of the metrics may take a while.