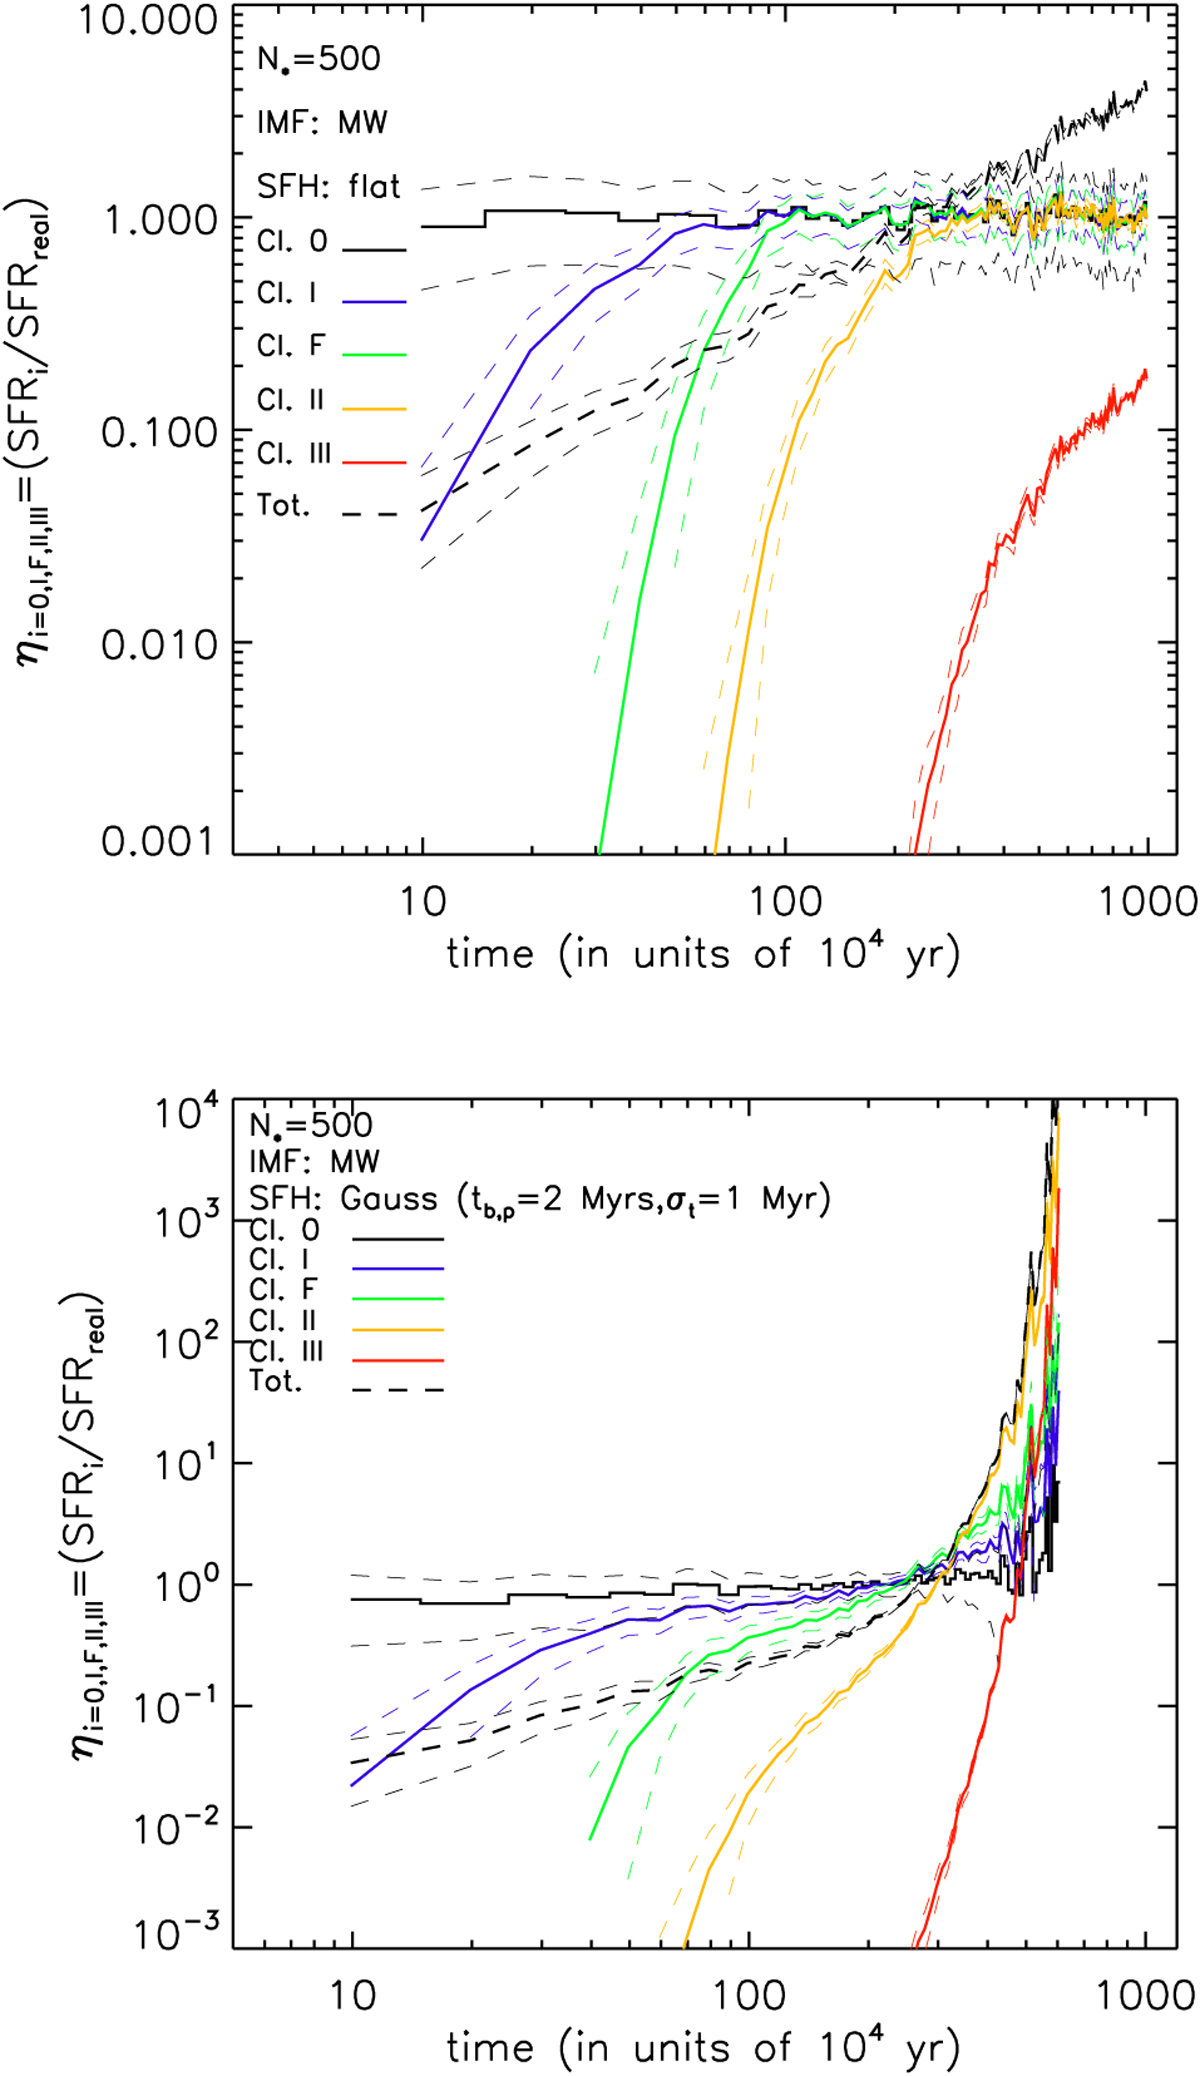
Fig. 7
Download original image
Top: time evolution of the ratio of the SFR measured using the populations of YSOs found in different classes (full lines) and the total population (dot-dashed line) and the real SFR that is generated in the models. Each line is an average over 250 clusters. Each cluster has N* = 500, a Milky Way-like IMF, and a flat SFH. Bottom: similar to the top panel, but here each clusters has N* = 500, a Milky Way-like IMF, and a Gaussian-like SFH. The Gaussian’s peak is at 2 Myr and the standard deviation is 1 Myr. In both panels, the dashed lines mark the 1σ uncertainty levels.
Current usage metrics show cumulative count of Article Views (full-text article views including HTML views, PDF and ePub downloads, according to the available data) and Abstracts Views on Vision4Press platform.
Data correspond to usage on the plateform after 2015. The current usage metrics is available 48-96 hours after online publication and is updated daily on week days.
Initial download of the metrics may take a while.