Fig. 3
Download original image
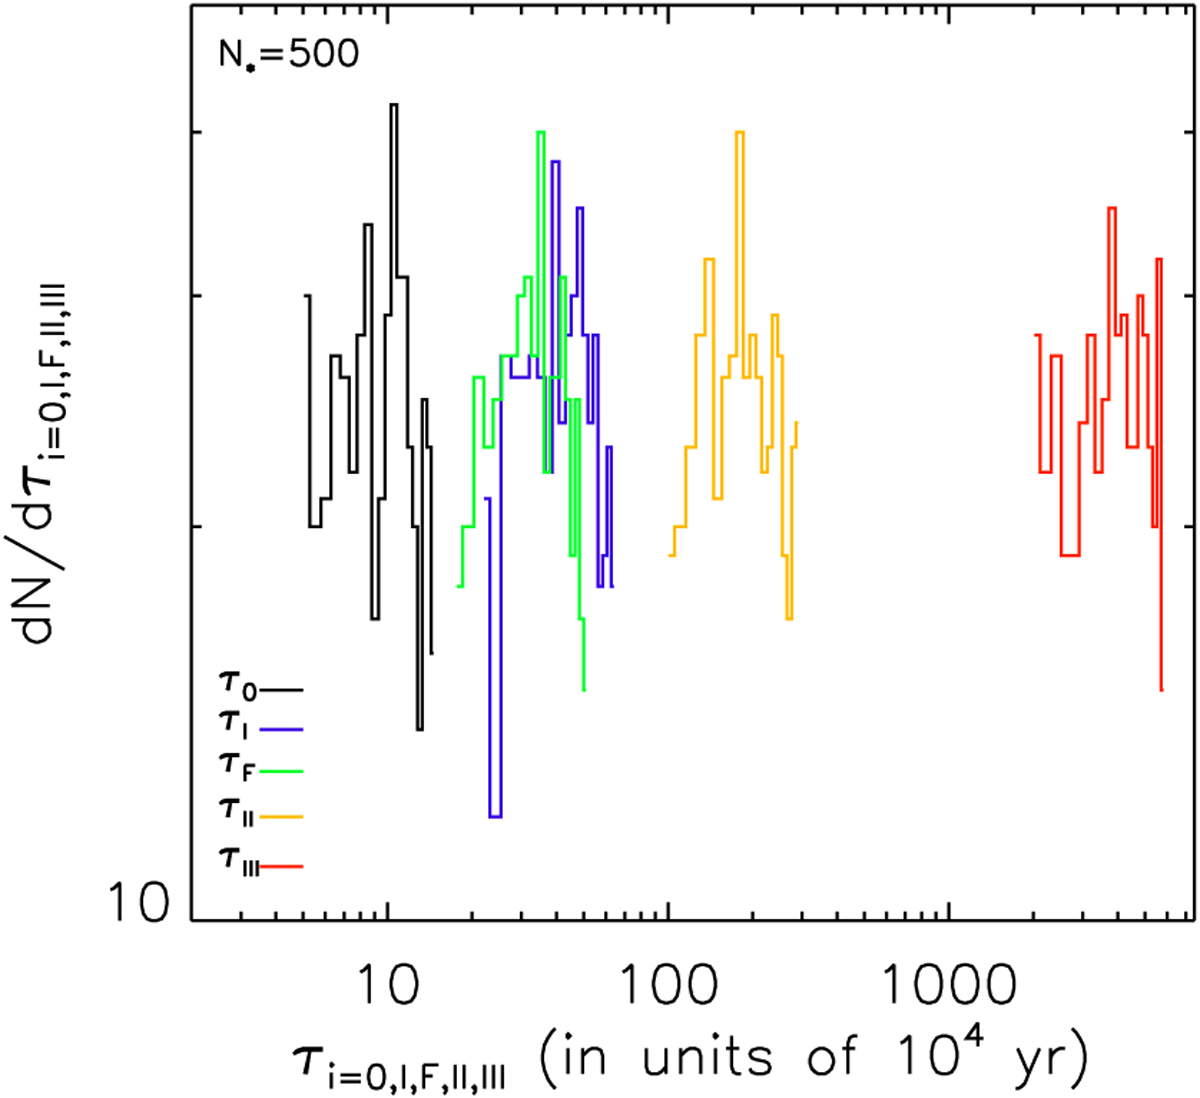
One realization of the distribution functions of the lifetimes associated with each protostellar class. The lifetimes are drawn using Eq. (4) with the mean value and standard deviation associated with each lifetime (see text for details). The bin size for each protostellar lifetime distribution is adjusted to the mean value of that distribution, namely the bin sizes are 5×10³ yr, 2.2 × 10⁴ yr, 1.75 × 10⁴ yr, 105 yr, and 2 × 10⁶ yr for the Class 0, Class I, the F Class, Class II, and Class III, respectively.
Current usage metrics show cumulative count of Article Views (full-text article views including HTML views, PDF and ePub downloads, according to the available data) and Abstracts Views on Vision4Press platform.
Data correspond to usage on the plateform after 2015. The current usage metrics is available 48-96 hours after online publication and is updated daily on week days.
Initial download of the metrics may take a while.