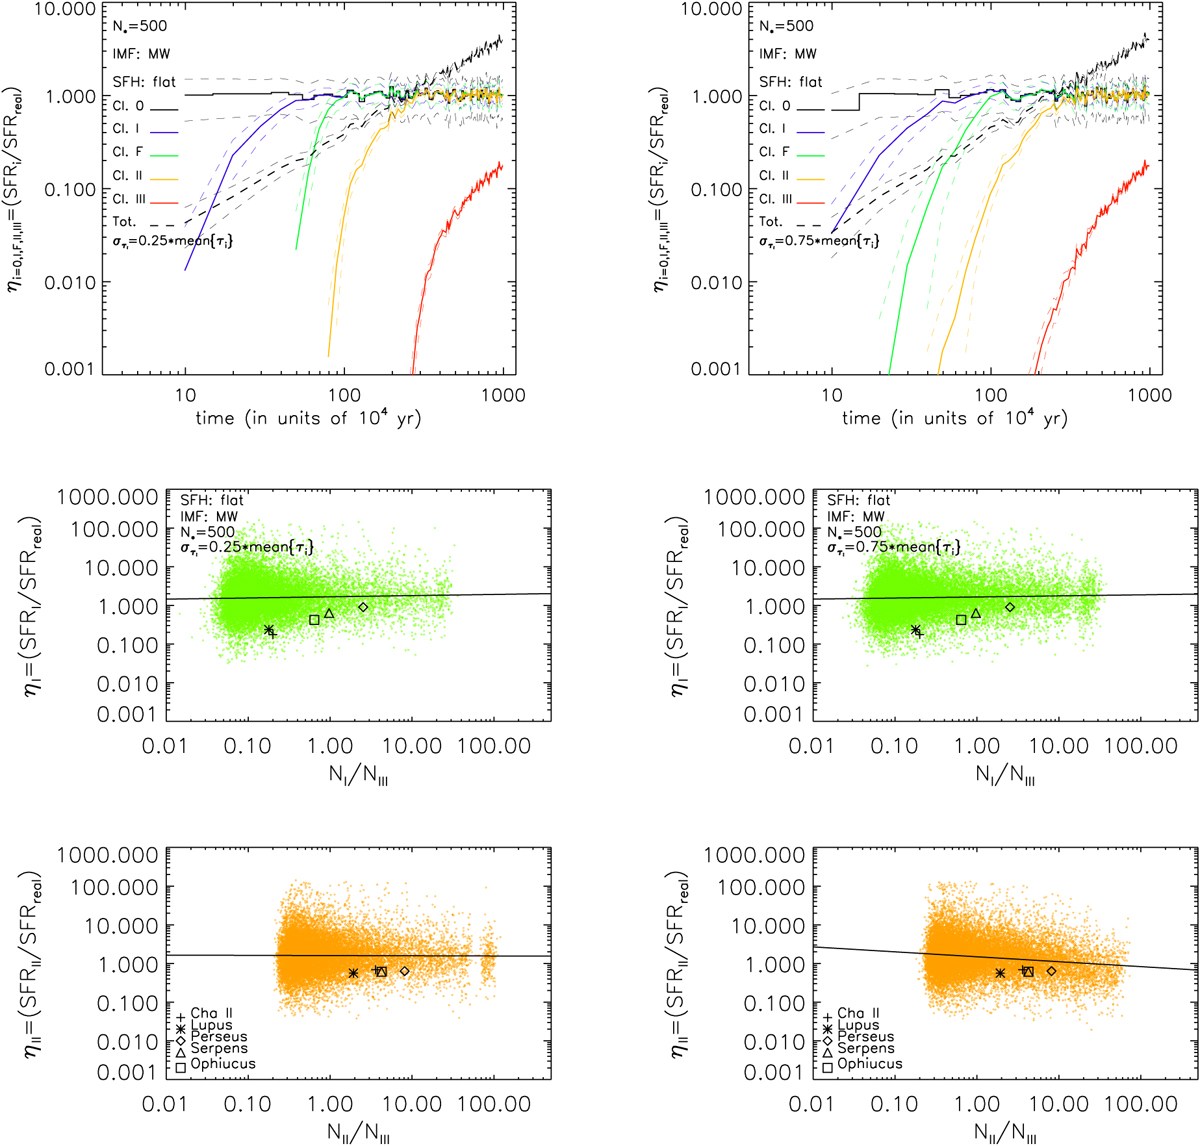
Fig. A.2
Download original image
Top row: same as Fig. 7 (top panel) but for cases where the width of the Gaussian distribution of the YSO lifetimes are taken as 0.25 the mean value (left) and 0.75 the mean value (right). Bottom row: Similar to Fig. 11 but for cases where the width of the Gaussian distribution of the YSO lifetimes are taken as 0.25 the mean value (left) and 0.75 the mean value (right).
Current usage metrics show cumulative count of Article Views (full-text article views including HTML views, PDF and ePub downloads, according to the available data) and Abstracts Views on Vision4Press platform.
Data correspond to usage on the plateform after 2015. The current usage metrics is available 48-96 hours after online publication and is updated daily on week days.
Initial download of the metrics may take a while.