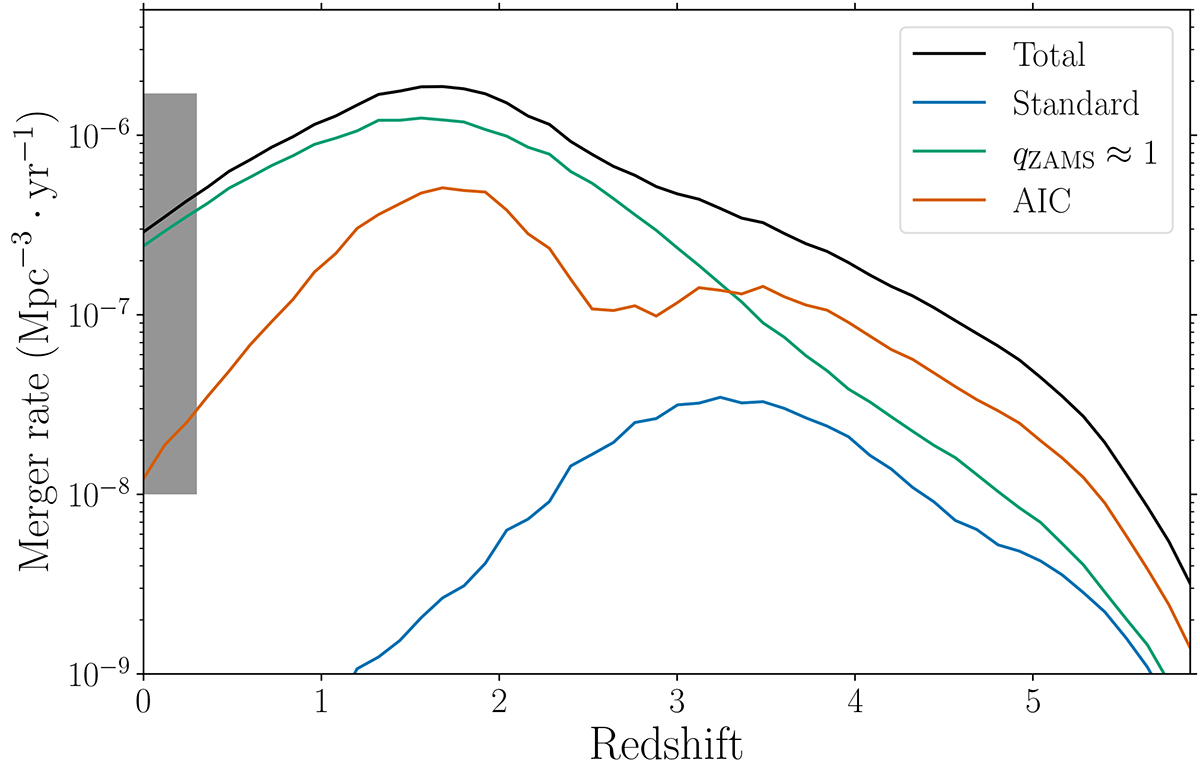
Fig. 10.

Download original image
Evolution of the merger rate with redshift. We show the total rate (black), standard evolutionary track (blue, see Sect. 3.1.1), equal-mass progenitors (green, Sect. 3.1.2), and AIC (orange, see Sect. 3.1.3). The relative contribution of each track to the merging population varies with redshift, with the AIC track prominent at high redshifts and the equal-mass track dominant at low redshifts. The grey box represents the constraint on the merger rate in the local Universe after the O3 observing run of LIGO/Virgo (Abbott et al. 2023b). It is stretched up to z = 0.3 for visualisation purposes.
Current usage metrics show cumulative count of Article Views (full-text article views including HTML views, PDF and ePub downloads, according to the available data) and Abstracts Views on Vision4Press platform.
Data correspond to usage on the plateform after 2015. The current usage metrics is available 48-96 hours after online publication and is updated daily on week days.
Initial download of the metrics may take a while.


