Open Access
Fig. 8
Download original image
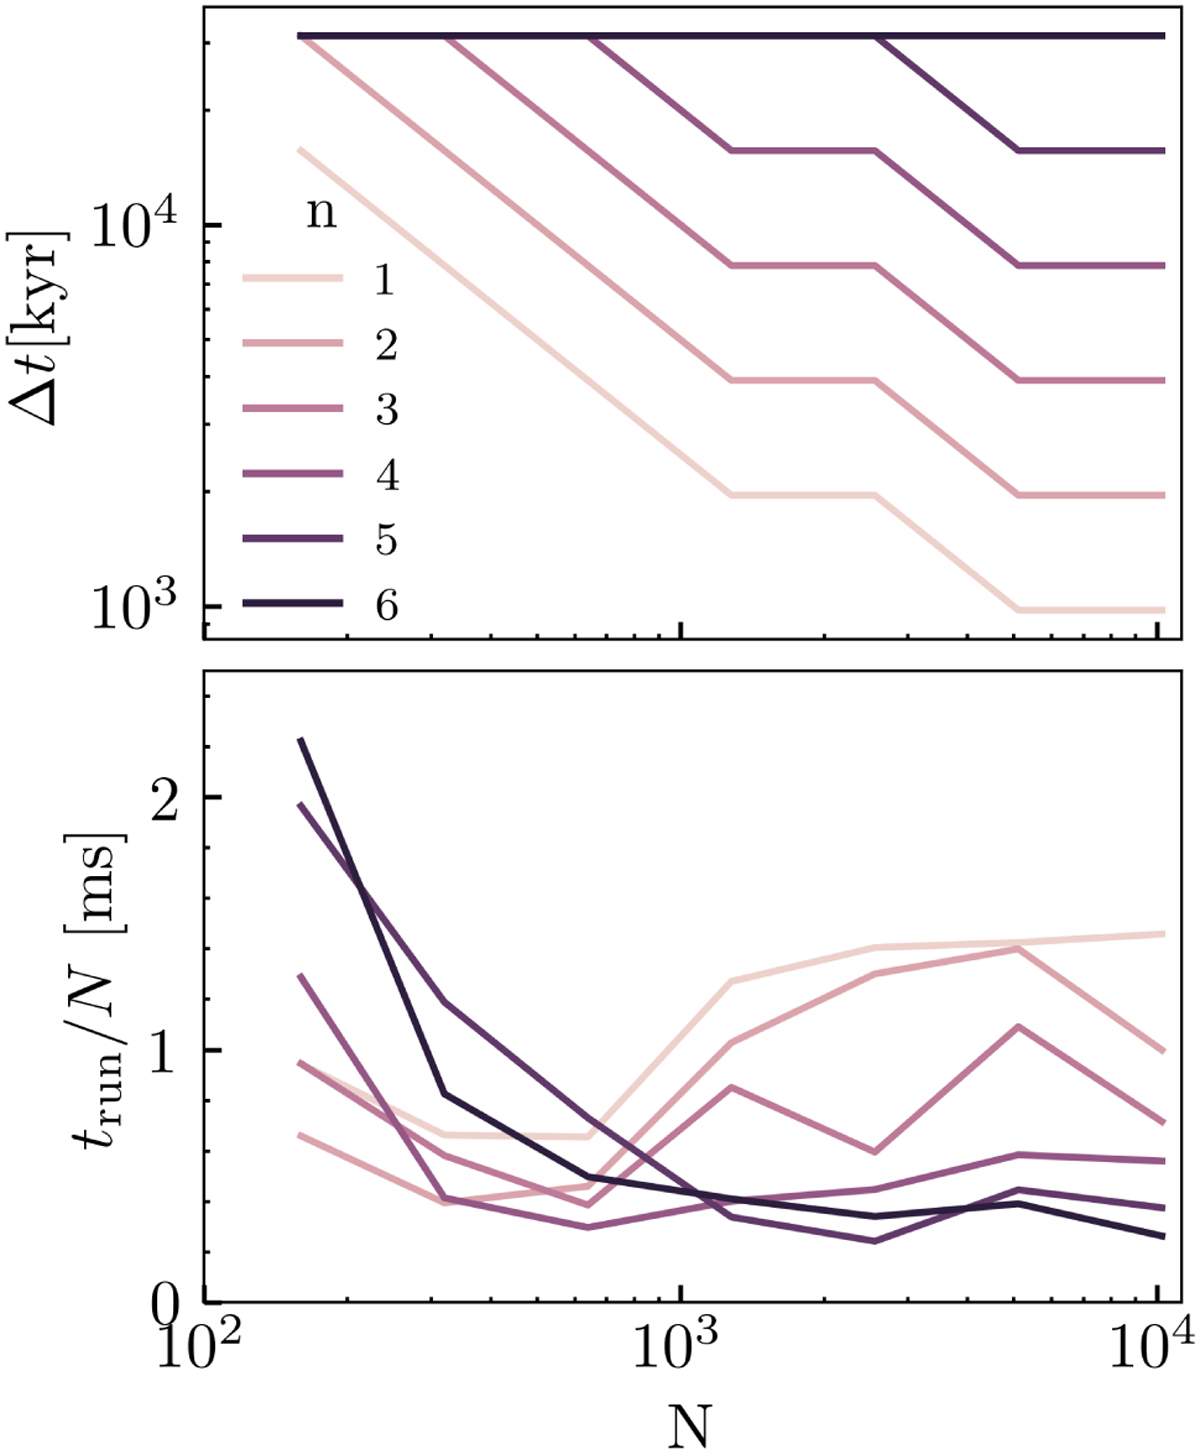
Overview of the convergence behavior of the Subsweep method. Top panel: the largest converging timestep Δt as a function of the number of particles N . The different lines represent runs with different number of allowed timestep levels n. Bottom panel: the total runtime trun divided by the number of particles N.
Current usage metrics show cumulative count of Article Views (full-text article views including HTML views, PDF and ePub downloads, according to the available data) and Abstracts Views on Vision4Press platform.
Data correspond to usage on the plateform after 2015. The current usage metrics is available 48-96 hours after online publication and is updated daily on week days.
Initial download of the metrics may take a while.