Fig. 6
Download original image
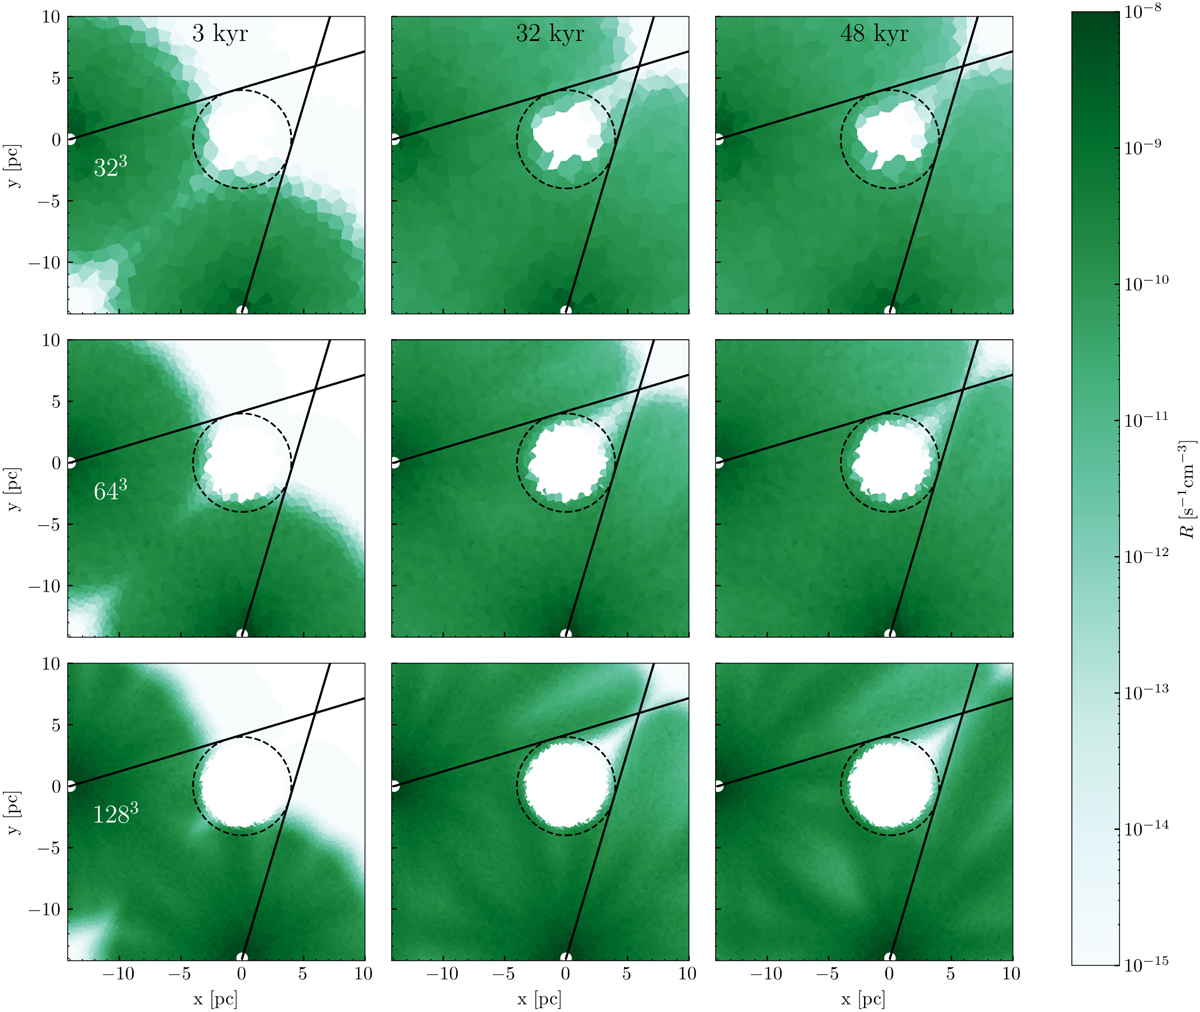
Photon rate R in a slice through the z = 0-plane of the simulation box. First row: 323 particles, Second row: 643 particles, Third row: 1283. First column: t = 3.0 kyr, second column: t = 32 kyr, third column: t = 48 kyr, The black dashed circle represents the overdense clump. White solid circles represent the position of the sources. The black dashed lines delineate the shape of an ideal shadow behind the clump.
Current usage metrics show cumulative count of Article Views (full-text article views including HTML views, PDF and ePub downloads, according to the available data) and Abstracts Views on Vision4Press platform.
Data correspond to usage on the plateform after 2015. The current usage metrics is available 48-96 hours after online publication and is updated daily on week days.
Initial download of the metrics may take a while.