Fig. 3
Download original image
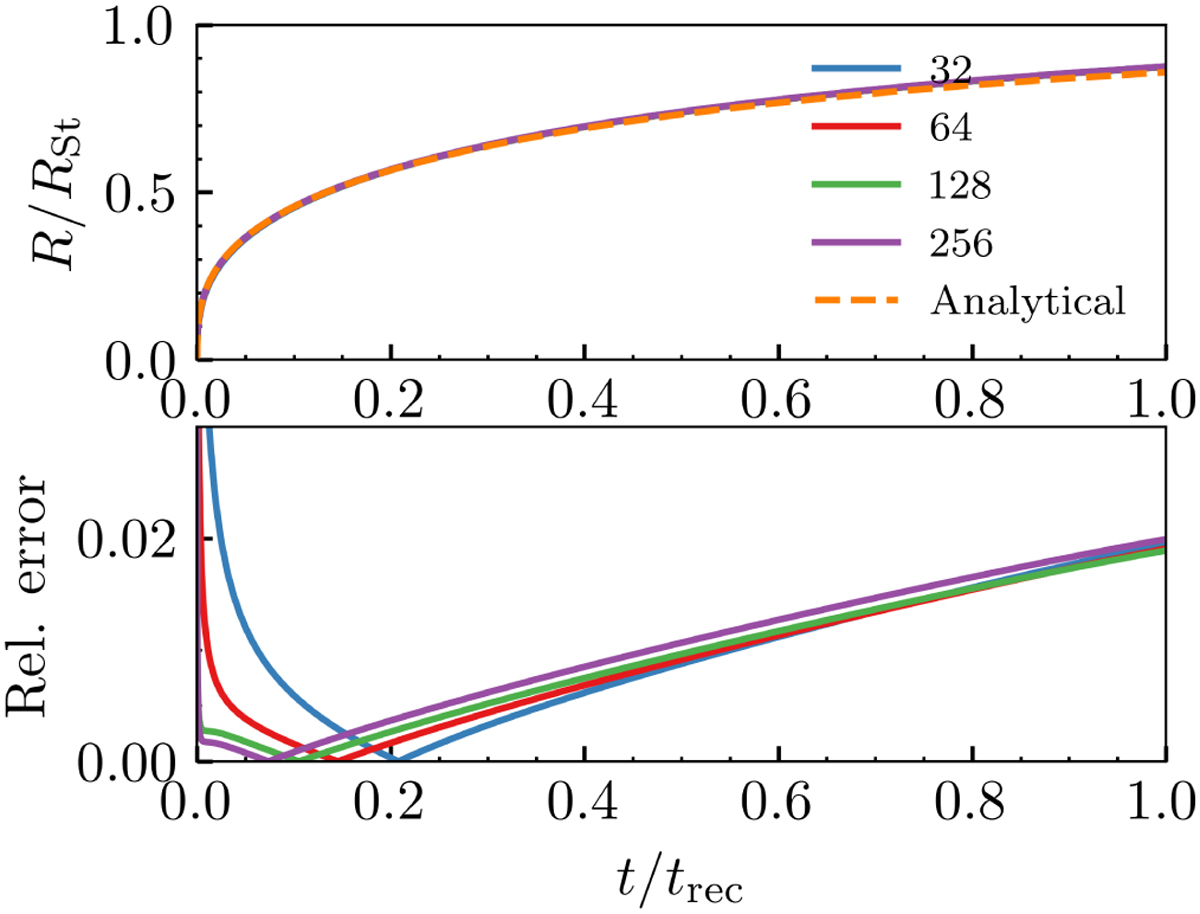
Results of the R-type expansion test. Top panel: the value of the radius of the ionized bubble at the center of the simulation box, in units of the Strömgren radius RSt , plotted as a function of time (normalized by the recombination time trec). Different lines represent different resolutions 323 (blue), 643 (red), 1283 (green), 2563 (purple) with the orange, dashed line representing the analytical prediction given by Eq. (20). Bottom panel: the relative error |R(t) − Rr(t)| /Rr(t) between the analytical prediction R(t) and the numerical results Rr(t) as a function of t/trec.
Current usage metrics show cumulative count of Article Views (full-text article views including HTML views, PDF and ePub downloads, according to the available data) and Abstracts Views on Vision4Press platform.
Data correspond to usage on the plateform after 2015. The current usage metrics is available 48-96 hours after online publication and is updated daily on week days.
Initial download of the metrics may take a while.