Fig. 2
Download original image
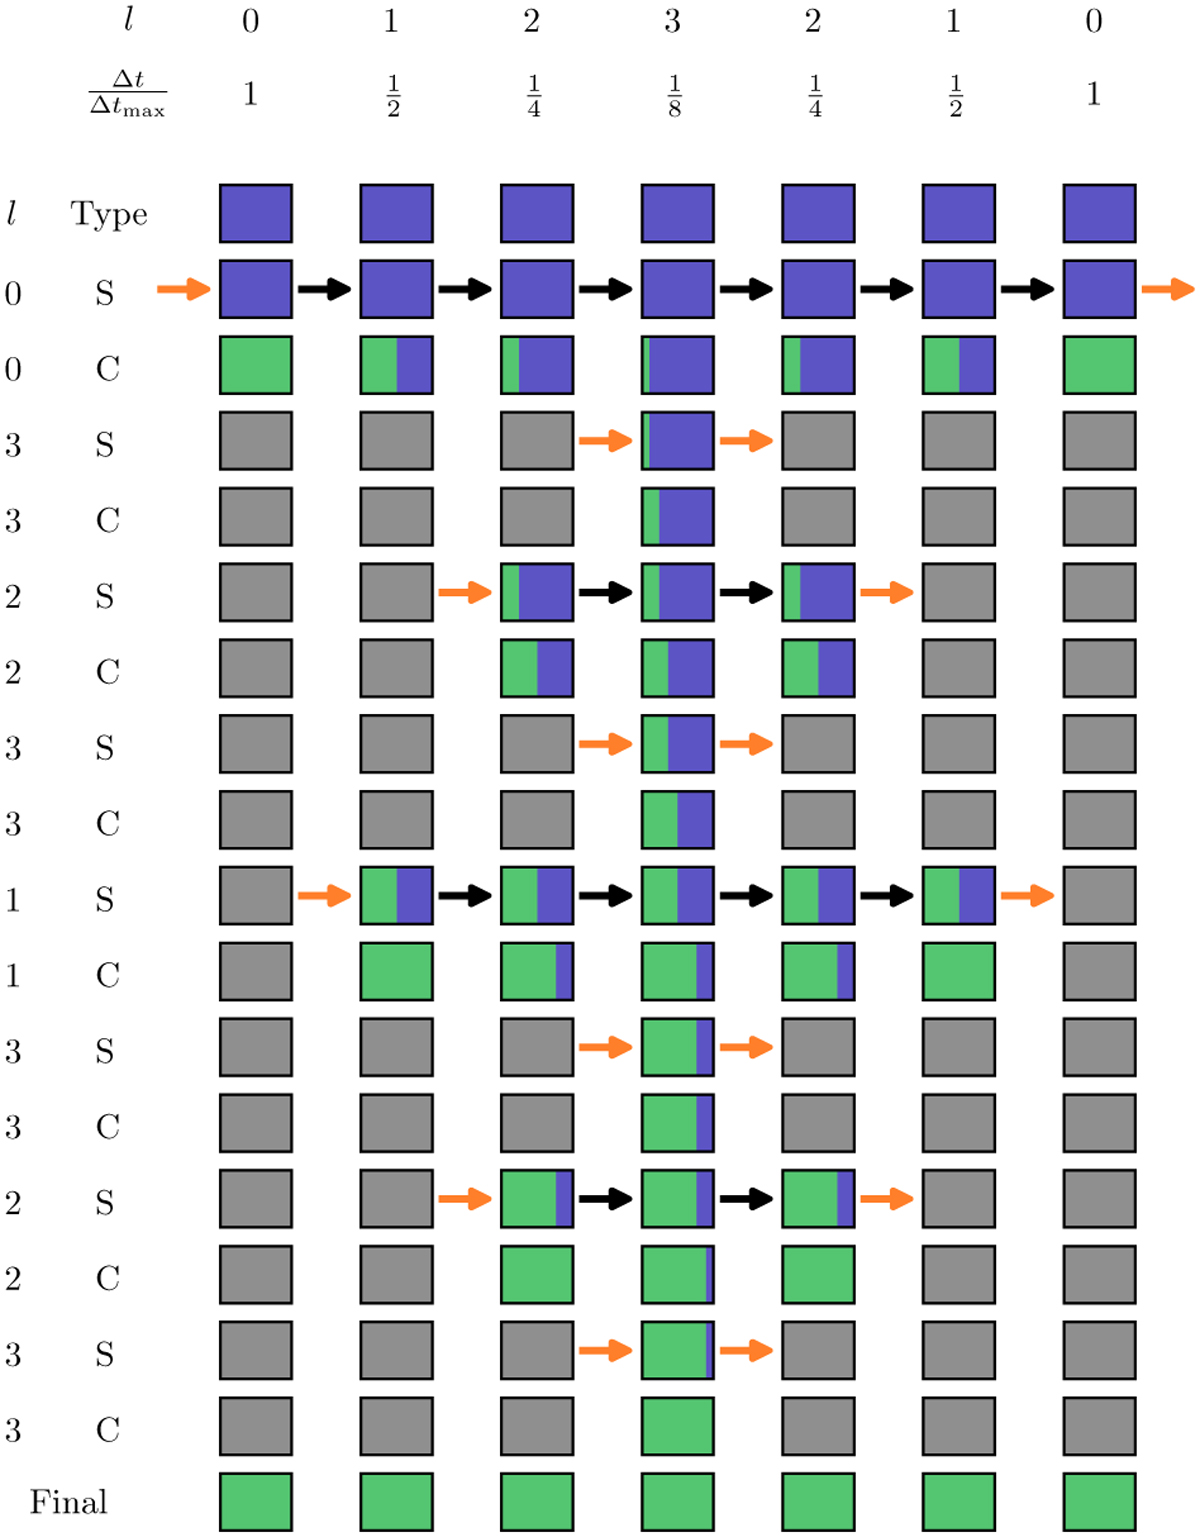
Illustration of the sweep substepping procedure. The rectangles represent cells, with the color of the cell indicating how far the cell has been integrated. A fully blue cell has not been integrated at all, while a green cell has been integrated for a total of Δtmax. Arrows represent fluxes going into the cell which are computed during the sweep steps. Black arrows denote normal fluxes, while orange arrows represent boundary terms for the sweep. Each row represents either a sweep (denoted by S) or a chemistry update (denoted by C) at the corresponding level l. The last row represents the final state with each cell having been fully integrated.
Current usage metrics show cumulative count of Article Views (full-text article views including HTML views, PDF and ePub downloads, according to the available data) and Abstracts Views on Vision4Press platform.
Data correspond to usage on the plateform after 2015. The current usage metrics is available 48-96 hours after online publication and is updated daily on week days.
Initial download of the metrics may take a while.