Open Access
Fig. 11
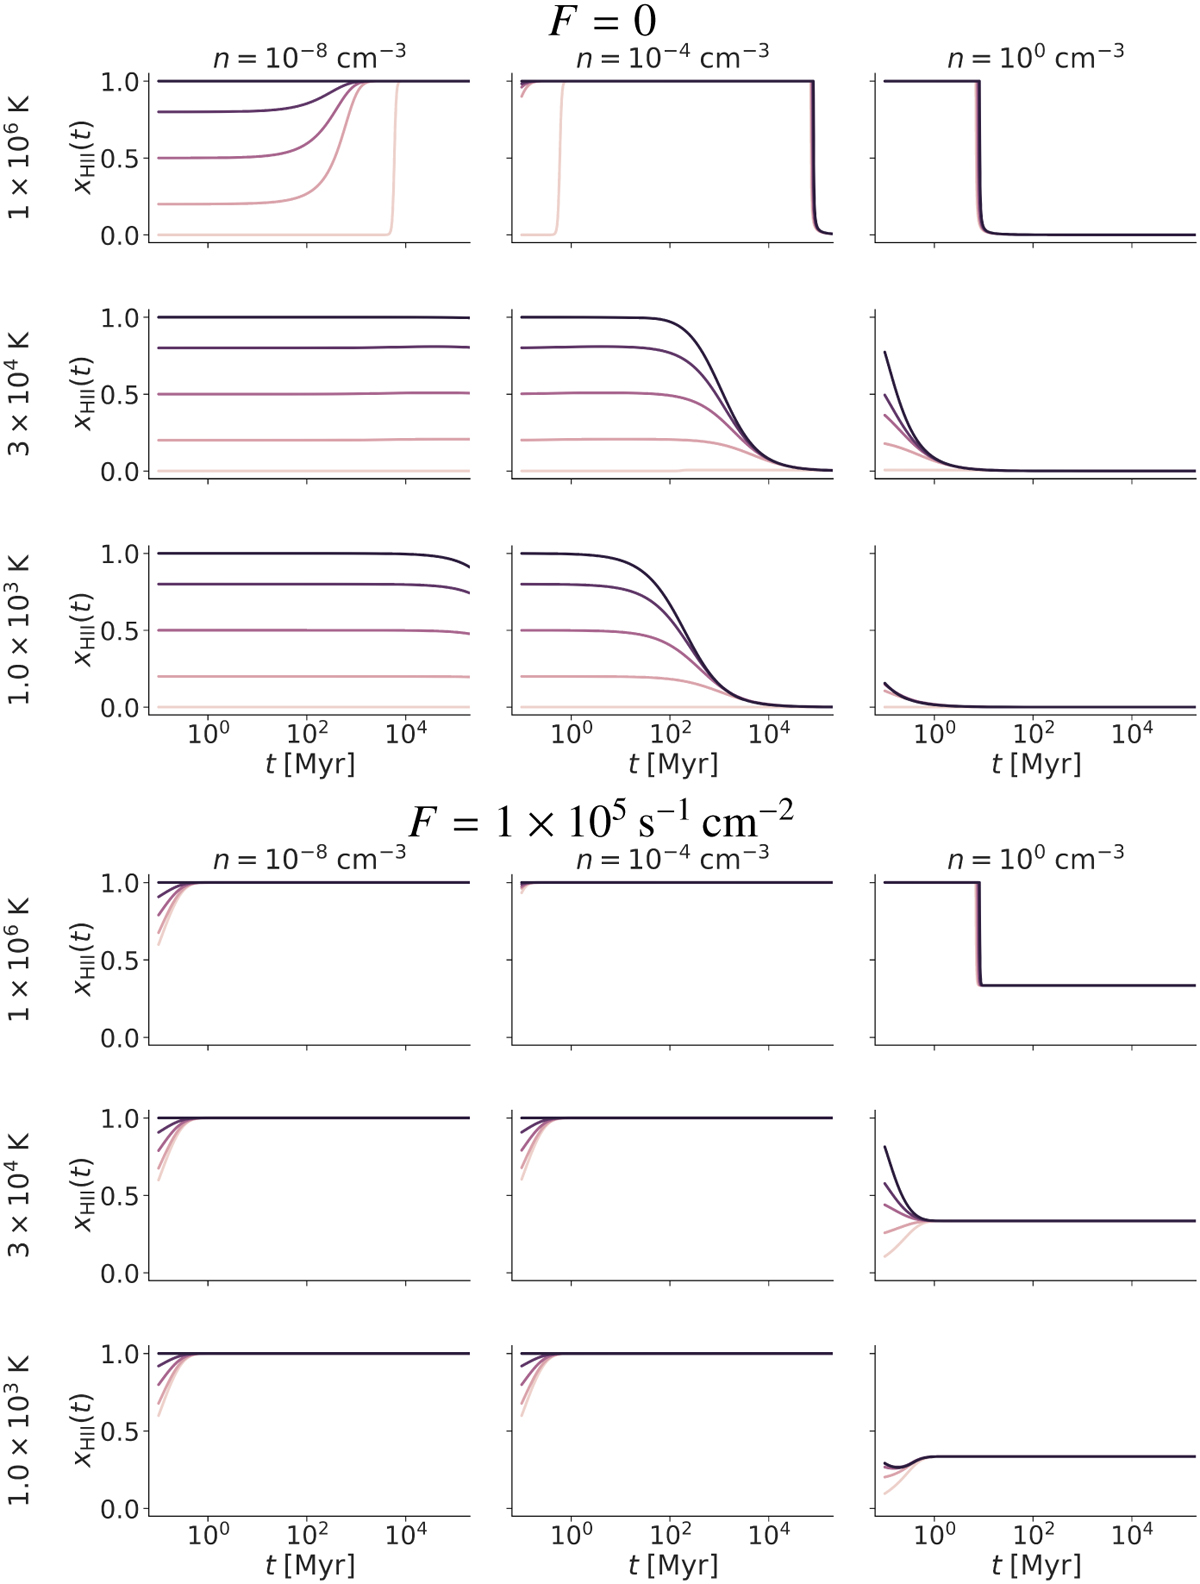
Download original image
Time evolution of the ionized hydrogen ionization fraction for different values of the density in the cell (columns), different initial temperatures (rows), and different values of the initial ionized fraction (line colors). Top panel: no ionizing flux. Bottom panel: with an ionizing flux of 1 × 10⁵ s−1 cm−2.
Current usage metrics show cumulative count of Article Views (full-text article views including HTML views, PDF and ePub downloads, according to the available data) and Abstracts Views on Vision4Press platform.
Data correspond to usage on the plateform after 2015. The current usage metrics is available 48-96 hours after online publication and is updated daily on week days.
Initial download of the metrics may take a while.