Fig. 8.
Download original image
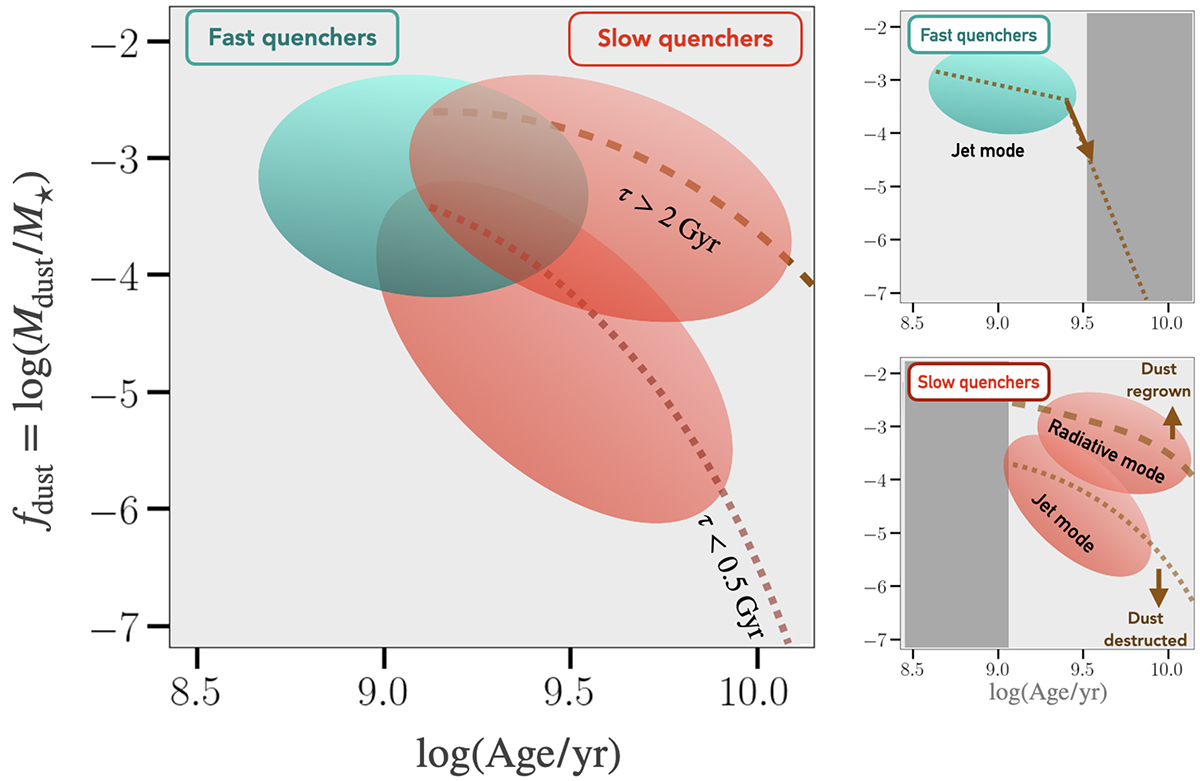
Qualitative sketch explaining the evolution of fdust with stellar age within the quenched phase, as presented in the bottom panel of Fig. 7. The cyan cloud illustrates the position of fast quenchers, while the two red clouds illustrate the position of dust-poor and dust-rich slow quenchers. The evolutionary directions (marked with arrows) for each sample are shown along with the main physical mechanisms involved in their dust evolution. The meaning of lines in the large panel is the same as in Fig. 7. The dark-grey shaded regions in the two subplots from the right panel delineate the part of the age-dust plane devoid of the given QG.
Current usage metrics show cumulative count of Article Views (full-text article views including HTML views, PDF and ePub downloads, according to the available data) and Abstracts Views on Vision4Press platform.
Data correspond to usage on the plateform after 2015. The current usage metrics is available 48-96 hours after online publication and is updated daily on week days.
Initial download of the metrics may take a while.