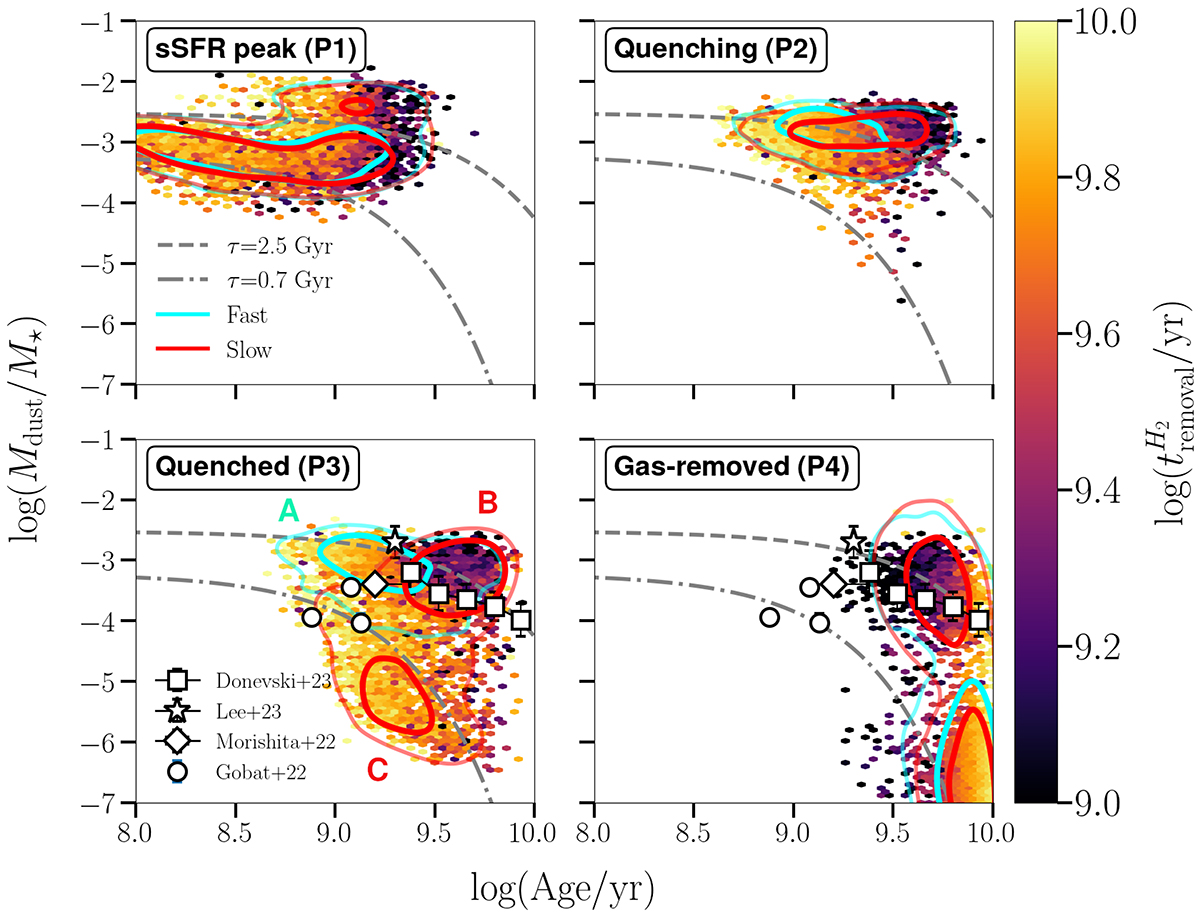
Fig. 7.
Download original image
Evolution of fdust with stellar age. We track the same evolutionary stages as introduced in Sect. 3.2. Points are colour-coded with the mean quenched timescale, that is the time interval between the P2 and P4. grey dashed and dashed-dotted lines show the exponential decrease of dust abundance assuming a timescale of τ = 2.5 Gyr and τ = 0.7 Gyr respectively and are motivated by Michałowski et al. (2019) and Lee et al. (2024). White squares denote the binned medians from the sample of dusty QGs observed in the COSMOS field (Donevski et al. 2023). Other markers show various QGs followed-up with ALMA: empty star (z = 2, Lee et al. 2024), empty circles (z ∼ 1.5 − 2, Gobat et al. 2022), and empty diamond (z = 2.149, Morishita et al. 2022). Cyan(red) contours define the 50th and 90th percentile of the distribution inferred for the fast(slow) QGs from this study, respectively. In the bottom left panel, the three main peaks of the distribution are labelled A, B, and C.
Current usage metrics show cumulative count of Article Views (full-text article views including HTML views, PDF and ePub downloads, according to the available data) and Abstracts Views on Vision4Press platform.
Data correspond to usage on the plateform after 2015. The current usage metrics is available 48-96 hours after online publication and is updated daily on week days.
Initial download of the metrics may take a while.