Fig. 6.
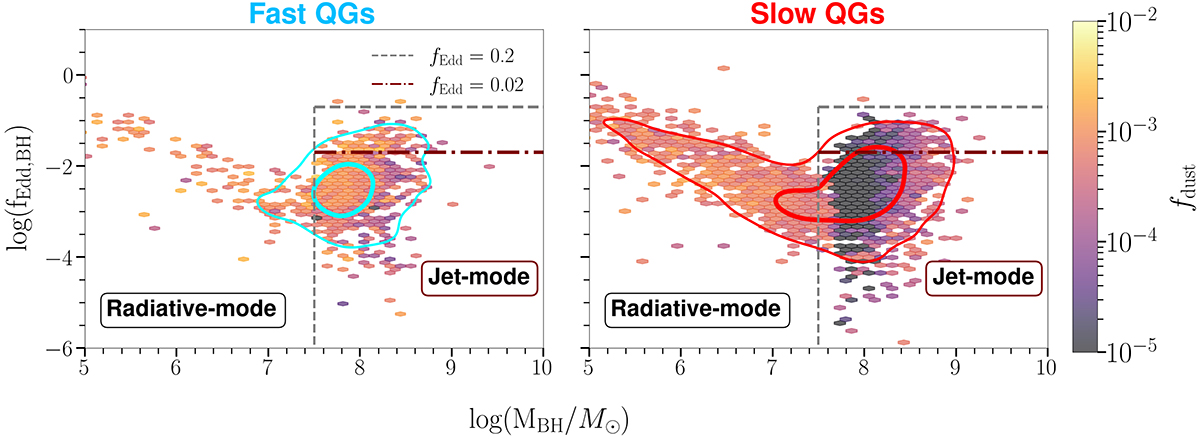
Download original image
Distribution of the fEdd over the central black hole mass MBH of the sample of fast (left) and slow (right) field QGs at the quenched stage. The colour coding shows the median dust fraction fdust computed for the quenched stage (that is, at the P3 evolutionary point). The vertical dashed line represents the lower mass limit for the activation of jet mode in SIMBA (MBH = 107.5). The dashed horizontal line delimits the starting of the transition from a radiative feedback mode to a jet mode (fEdd = 0.2), while the dashed-dotted line delimits the region with fully set jet mode (fEdd < 0.02). The red and blue contours represent the 50 and 90 percentile levels for the slow and fast quenching sub-samples respectively.
Current usage metrics show cumulative count of Article Views (full-text article views including HTML views, PDF and ePub downloads, according to the available data) and Abstracts Views on Vision4Press platform.
Data correspond to usage on the plateform after 2015. The current usage metrics is available 48-96 hours after online publication and is updated daily on week days.
Initial download of the metrics may take a while.