Fig. 5.
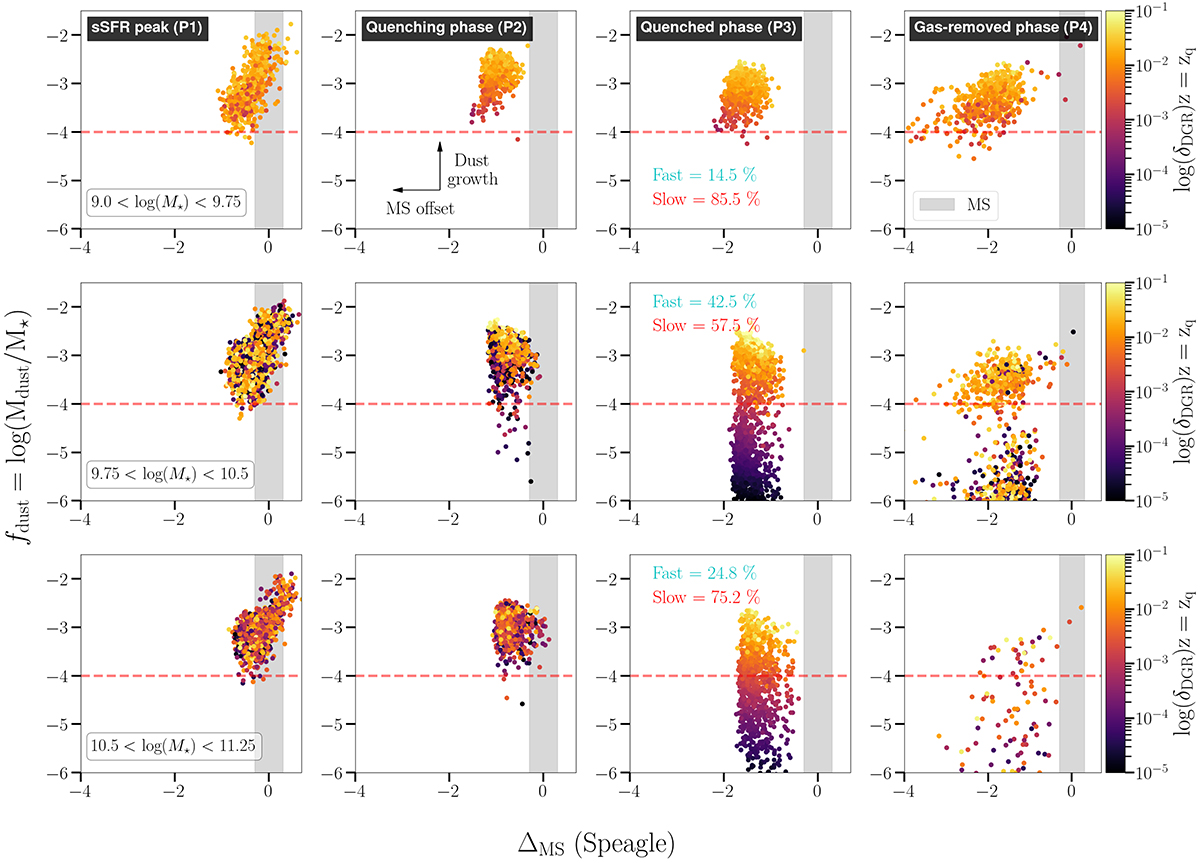
Download original image
Evolution of fdust with ΔMS for the field QGs. The ΔMS is derived following the best-fit relation from Speagle et al. (2014). Each column represents a different phase of the galaxy evolution as indicated in the legend. These are, from left to right: sSFR-peak phase (P1), quenching phase (P2), quenched phase (P3), and gas-removed phase (P4). Each row corresponds to different stellar mass bins calculated at the quenching time. Stellar masses increase from top to bottom, while the sample evolves from left to right. The grey shaded region defines the 0.3 dex scatter of the MS. Points are colour-coded for their δDGR calculated at the quenched phase (P3). Points with the same colours in different columns represent the same galaxy across different evolutionary stages. The horizontal arrow marks the direction of evolution with respect to the MS, while the vertical arrow shows the direction expected for increasing dust growth. For each panel, we show the fraction of fast(slow) QGs in the column corresponding to P3. To guide the eye, we show a dashed horizontal line (fdust = 10−4), which roughly corresponds to a cold gas fraction of 1% and marks an approximate observational limit of known dusty QGs detected with ALMA (see Section 5.2.4).
Current usage metrics show cumulative count of Article Views (full-text article views including HTML views, PDF and ePub downloads, according to the available data) and Abstracts Views on Vision4Press platform.
Data correspond to usage on the plateform after 2015. The current usage metrics is available 48-96 hours after online publication and is updated daily on week days.
Initial download of the metrics may take a while.