Fig. 4.
Download original image
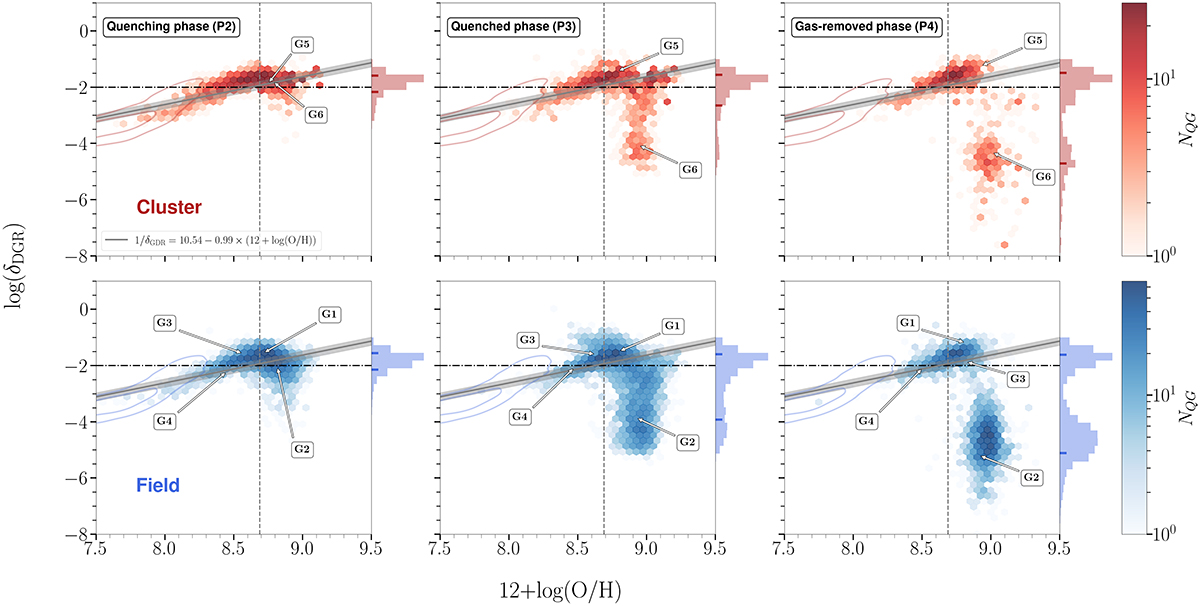
δDGR-metallicity plane for cluster QGs (upper panel) and field QGs (lower panel). Positions of QGs within the plane are shown for different evolutionary phases, as indicated in the legend. Contours define positions typical for the peak star formation phase. The intensity of colours refers to the number of sources. The vertical dashed line marks the solar value for the oxygen abundance (Z⊙), while the horizontal dashed-dotted line shows the reference value for the dust-to-gas ratio in SFGs from the local Universe δDGR = 1/100. The positions of galaxies introduced in Fig. 1 are indicated with arrows. The scaling relation between Zgas and δDGR for local SFGs (Magdis et al. 2012) is shown as a solid line with equation indicated in the legend. Histograms on the y-axis show the PDF distribution of log(δDGR) for both samples, with small ticks marking the 16th and 84th percentile.
Current usage metrics show cumulative count of Article Views (full-text article views including HTML views, PDF and ePub downloads, according to the available data) and Abstracts Views on Vision4Press platform.
Data correspond to usage on the plateform after 2015. The current usage metrics is available 48-96 hours after online publication and is updated daily on week days.
Initial download of the metrics may take a while.