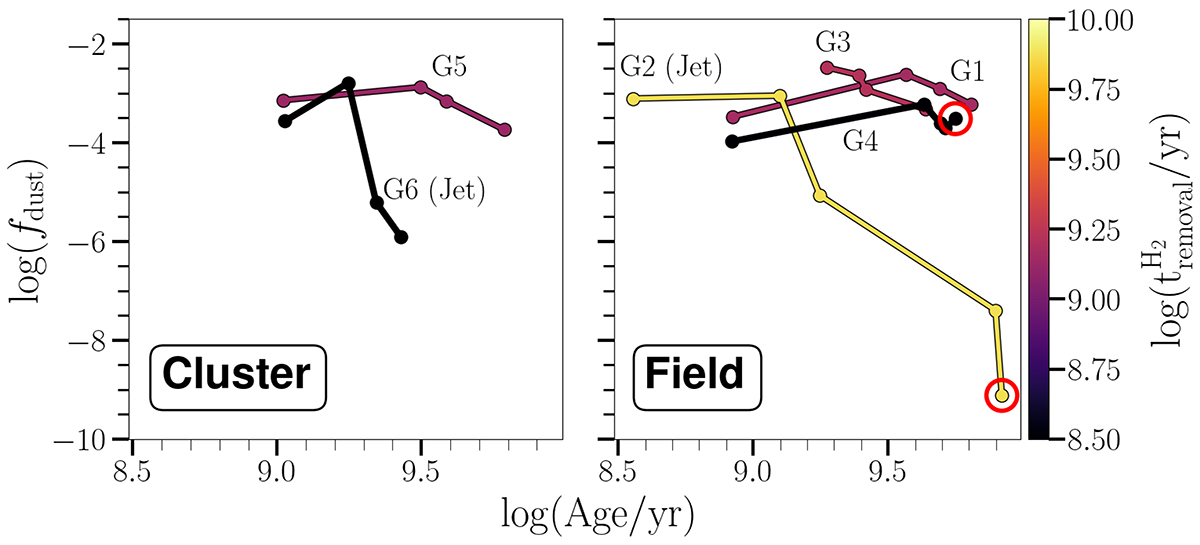
Fig. B.1.
Download original image
Evolution of galaxies from Fig. 1 in the dust-stellar-age plane for the cluster (left) and field (right) galaxies. The mass-weighted stellar age is on the x-axis, while the fdust is shown on the y-axis. Each galaxy is colour-coded with the timescale tremovalH2 to reach the dry-phase (P4) from the quenched phase (P3). The properties of each galaxy are evaluated from left to right at the P1, P2, P3, and P4. If present, the red circle symbolises the values at z = 0.
Current usage metrics show cumulative count of Article Views (full-text article views including HTML views, PDF and ePub downloads, according to the available data) and Abstracts Views on Vision4Press platform.
Data correspond to usage on the plateform after 2015. The current usage metrics is available 48-96 hours after online publication and is updated daily on week days.
Initial download of the metrics may take a while.