Fig. 1.
Download original image
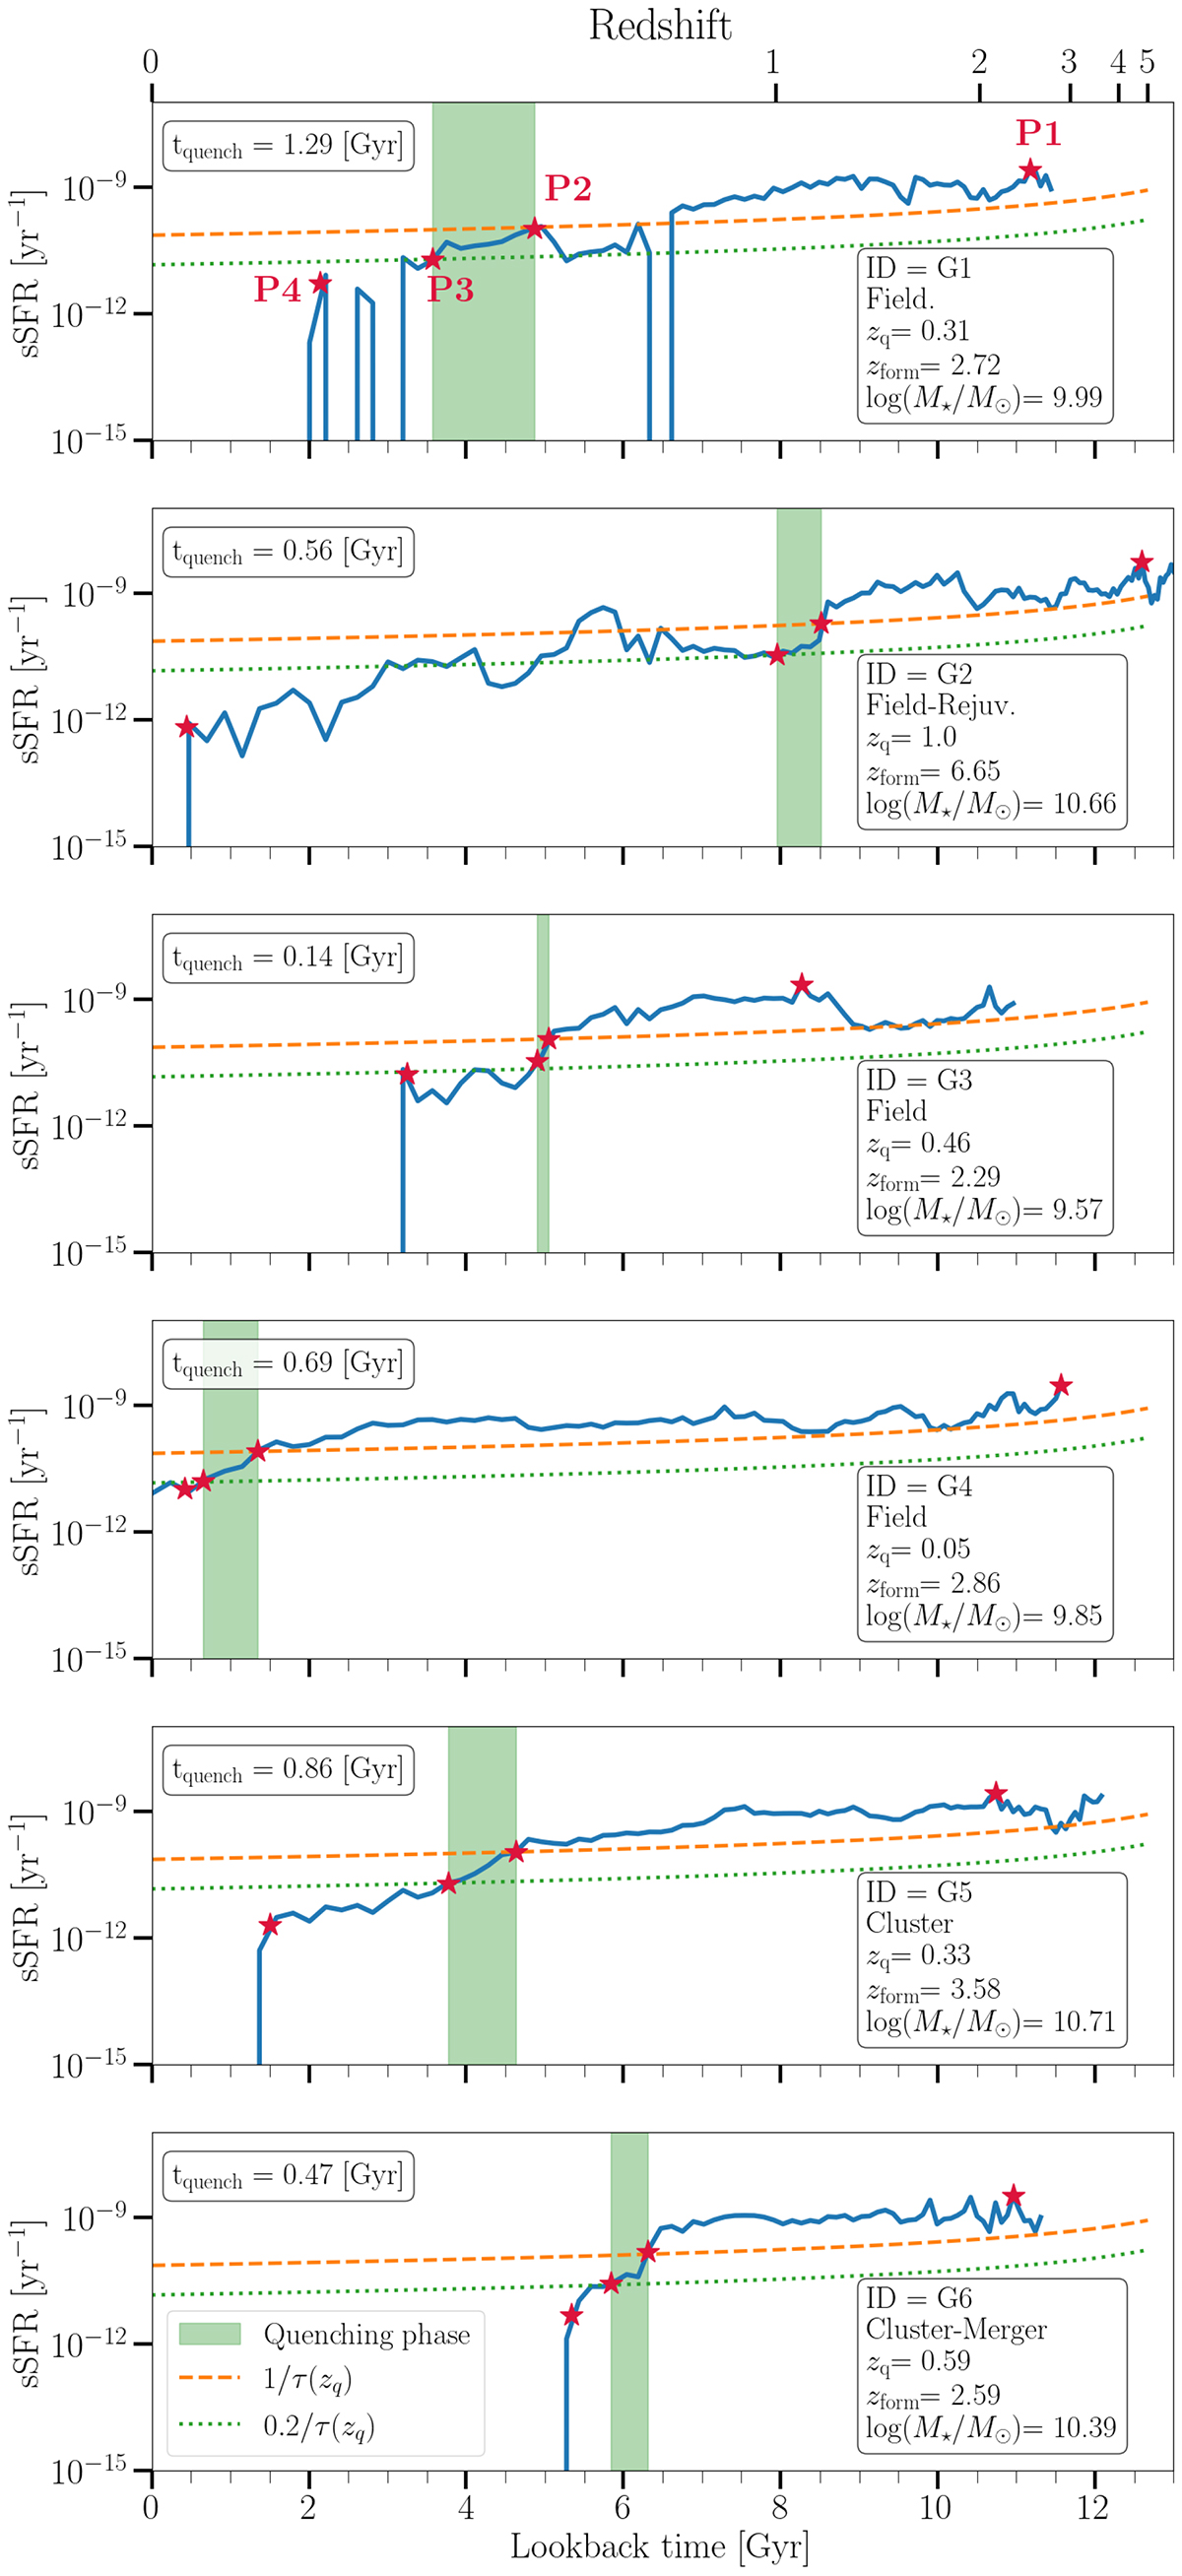
Example sSFR versus look-back time for six representative QGs from this study. The sources’ SFHs are illustrated with blue lines. Panels display QGs along with their corresponding names, quenching times (tquench), the redshift of the quenching event (zq), the formation redshift (zform) and the stellar mass (log(M⋆/M⊙). Look-back time is shown on the bottom x-axis in Gyr, while the top x-axis shows the corresponding redshift. The sSFR is illustrated on the y-axis as log-scaled. The SFHs are superimposed with orange and green lines, which mark the thresholds for the start and end of the quenching event, respectively (see the description in Sect. 3.1). The green vertical band delimits the duration of the quenching phase, while red stars are the four critical points we use to determine the sample evolution as described in Sect. 3.2.
Current usage metrics show cumulative count of Article Views (full-text article views including HTML views, PDF and ePub downloads, according to the available data) and Abstracts Views on Vision4Press platform.
Data correspond to usage on the plateform after 2015. The current usage metrics is available 48-96 hours after online publication and is updated daily on week days.
Initial download of the metrics may take a while.