Fig. 9.
Download original image
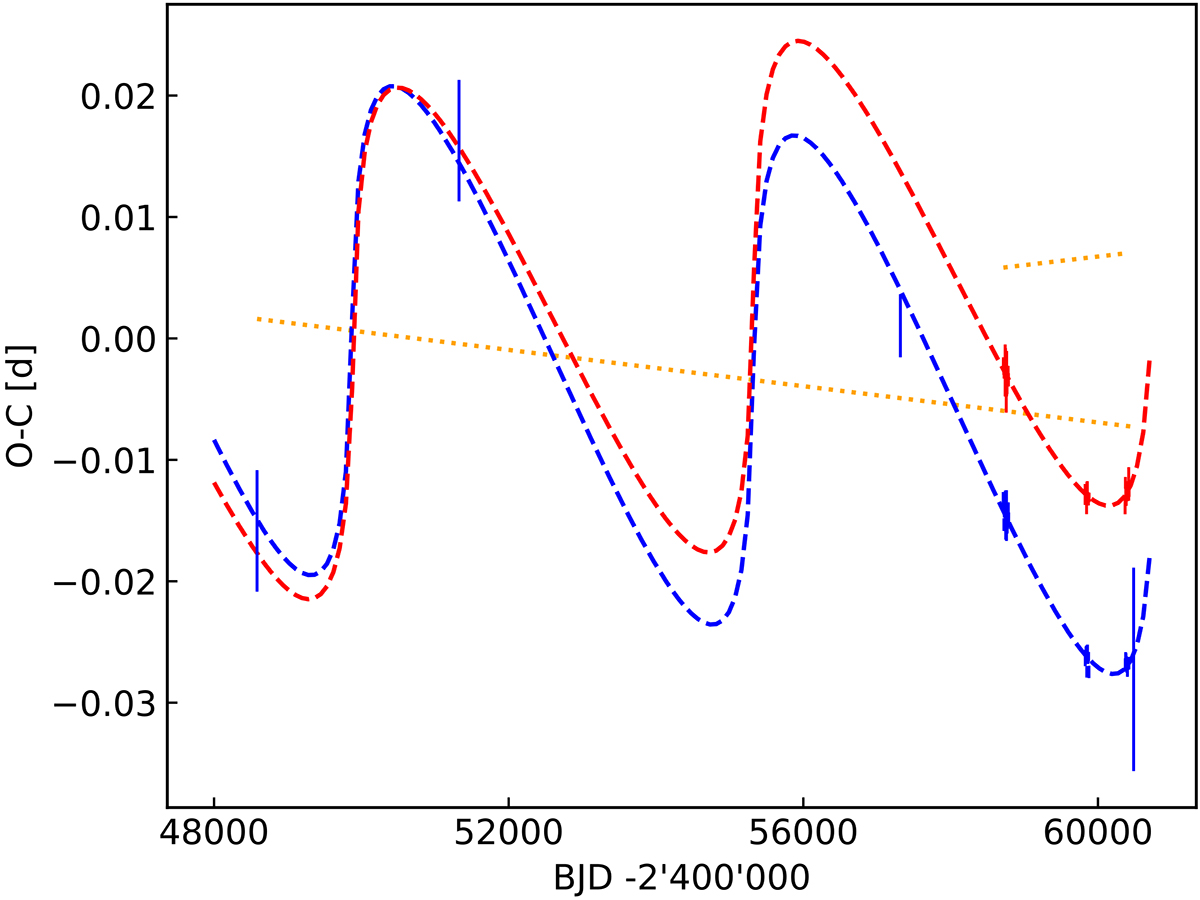
Values of the observed times of eclipse minima minus the values of those computed with a light time effect with the parameters given in Table 1 plotted as a function of time. The blue O–C symbols correspond to the primary eclipse and the red symbols correspond to secondary eclipse. The symbol size indicates the uncertainty as given in Table A.1. The dashed blue and red lines are possible solutions given by the light time equation. The offset between the solutions is due the time difference by which the secondary minimum lags P/2 in the phased orbit. The dotted yellow lines indicates the O–C trends of the primary and secondary eclipses, corrected for the light time effect.
Current usage metrics show cumulative count of Article Views (full-text article views including HTML views, PDF and ePub downloads, according to the available data) and Abstracts Views on Vision4Press platform.
Data correspond to usage on the plateform after 2015. The current usage metrics is available 48-96 hours after online publication and is updated daily on week days.
Initial download of the metrics may take a while.