Fig. 15.
Download original image
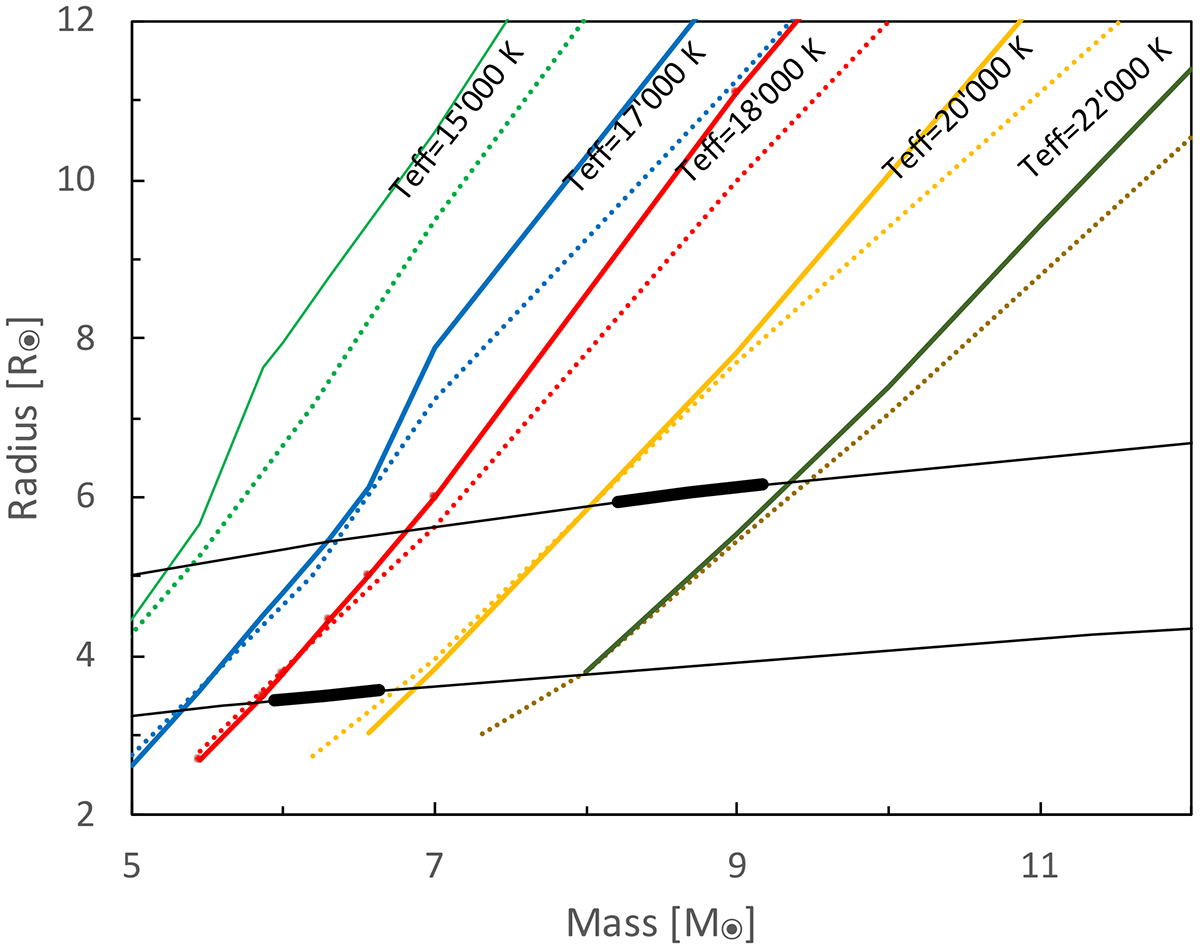
Stellar radii as a function of mass from standard stellar evolution models (Ekström et al. 2012). The slanted colored curves connect the radii of evolutionary models as a function of mass for a temperature as indicated by the label. The full drawn lines show models with rotational mixing of the core, and the dotted lines are from nonration-mixed cores. The thin black curves show the possible mass and radius solutions from the fit to the light curve when the semimajor axis is taken as the free parameter. The upper black curve corresponds to the relation between R1 and M1, and the lower black curves corresponds to that of R2 on M2. The thick parts of the black lines indicate the mass range we derived from the spectroscopic observations in Sect. 3.
Current usage metrics show cumulative count of Article Views (full-text article views including HTML views, PDF and ePub downloads, according to the available data) and Abstracts Views on Vision4Press platform.
Data correspond to usage on the plateform after 2015. The current usage metrics is available 48-96 hours after online publication and is updated daily on week days.
Initial download of the metrics may take a while.