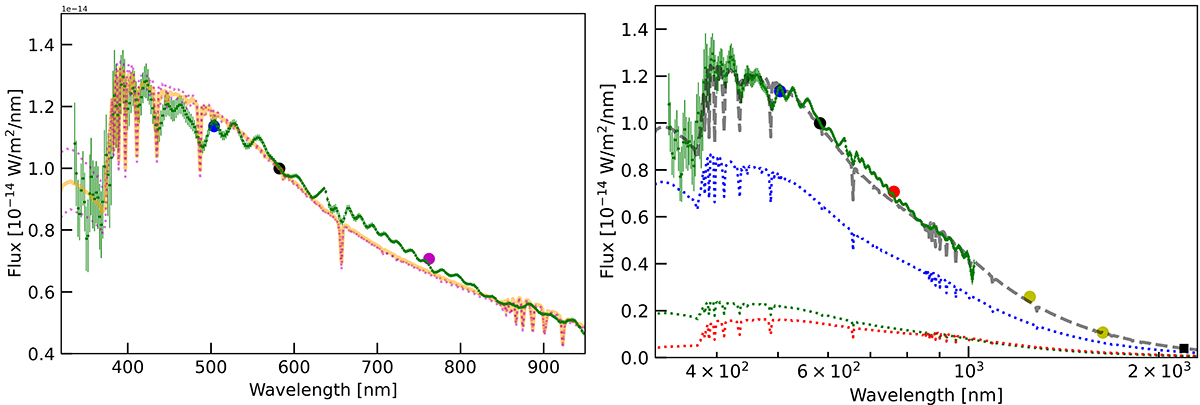
Fig. 14.
Download original image
Measured spectral energy distribution of V424 Cep as given by the scaled Gaia XP spectrum (green curve with error bars) and fluxes from Bp, G, Rp, J, H, and K photometry (dots), fit with a two-star composite spectrum as described in the text (orange line). This fit spectrum is for a primary effective temperature T1 = 17 000 K, reddened by EB − V = 0.645, and a radius R1 = 7.5. Left panel: Composite spectra for a primary T1 = 15 000 K and 19 000 K (magenta dots), each with a 2000 K lower temperature for the secondary. The lower and higher temperature spectra are reddened by EB − V = 0.64 and 0.67, respectively. Right panel: Composite spectrum (dashed gray) comprised of three spectra and reddened by EB − V = 0.7 (using R = 3.0), which is almost identical to the orange line in the left panel. The primary has a temperature of T1 = 21 000 K (dotted blue line), the secondary of T2 = 19 000 K (dotted green line), and the third-light spectrum has T3 = 10 000 K with 15% of the total flux at the TESS passband (dotted red line).
Current usage metrics show cumulative count of Article Views (full-text article views including HTML views, PDF and ePub downloads, according to the available data) and Abstracts Views on Vision4Press platform.
Data correspond to usage on the plateform after 2015. The current usage metrics is available 48-96 hours after online publication and is updated daily on week days.
Initial download of the metrics may take a while.