Open Access
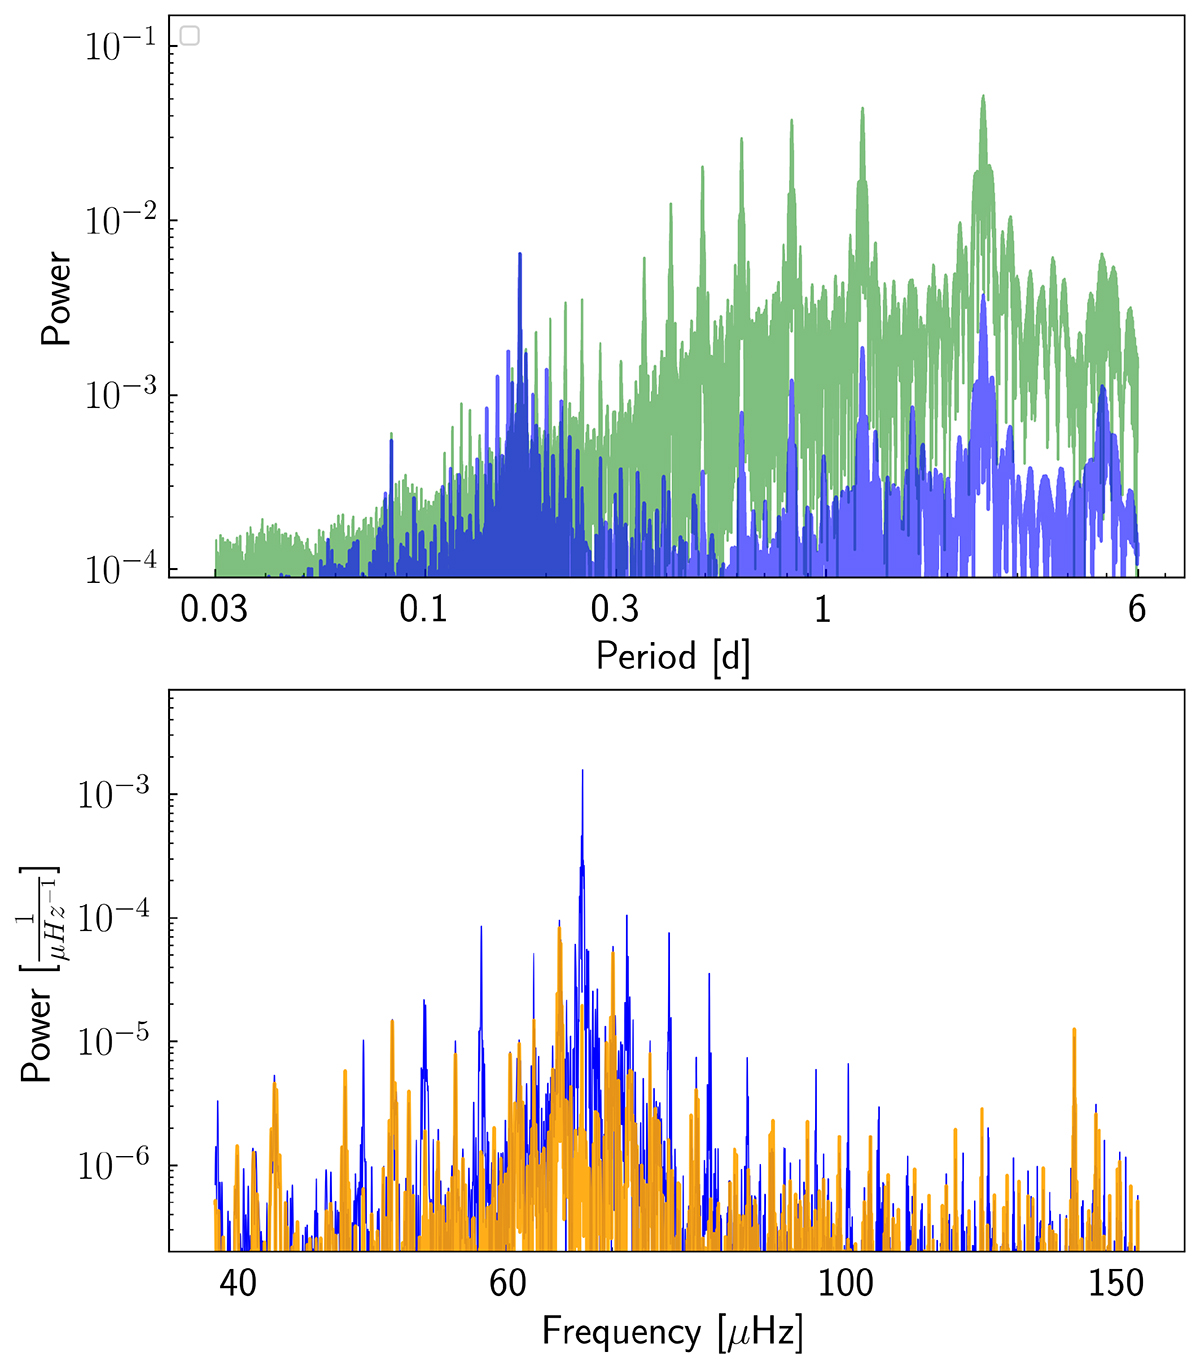
Fig. 11.
Download original image
Periodograms of the light curves. Top panel: Periodogram based on all data (green line), and periodogram without the eclipses (blue line). Bottom panel: As the upper panel, but plotted against frequency. The orange line marks the periodogram after the masked light curve was divided by the dominating pulsation period.
Current usage metrics show cumulative count of Article Views (full-text article views including HTML views, PDF and ePub downloads, according to the available data) and Abstracts Views on Vision4Press platform.
Data correspond to usage on the plateform after 2015. The current usage metrics is available 48-96 hours after online publication and is updated daily on week days.
Initial download of the metrics may take a while.