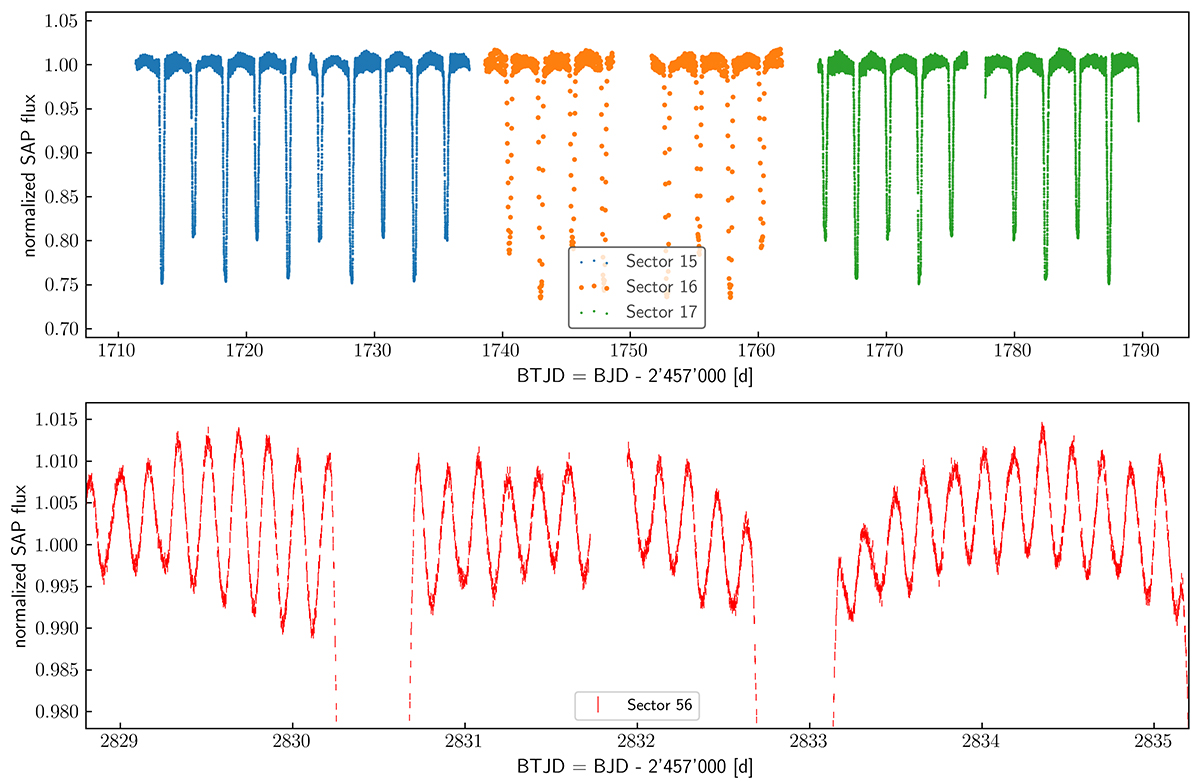
Fig. 1.
Download original image
Light curves of V424 Cep observed by the TESS satellite. Top: 79 d of the observations in sectors 15–17 (August 15, 2019, to October 7, 2019). Bottom: 6 d extract from the sector 56 observations (September 2022) plotted with the full time resolution of 2 min. The symbol size shows the precision of the individual measurements. The vertical scale is chosen to illustrate the pulsations, and it therefore truncates the eclipses.
Current usage metrics show cumulative count of Article Views (full-text article views including HTML views, PDF and ePub downloads, according to the available data) and Abstracts Views on Vision4Press platform.
Data correspond to usage on the plateform after 2015. The current usage metrics is available 48-96 hours after online publication and is updated daily on week days.
Initial download of the metrics may take a while.