Fig. 7.
Download original image
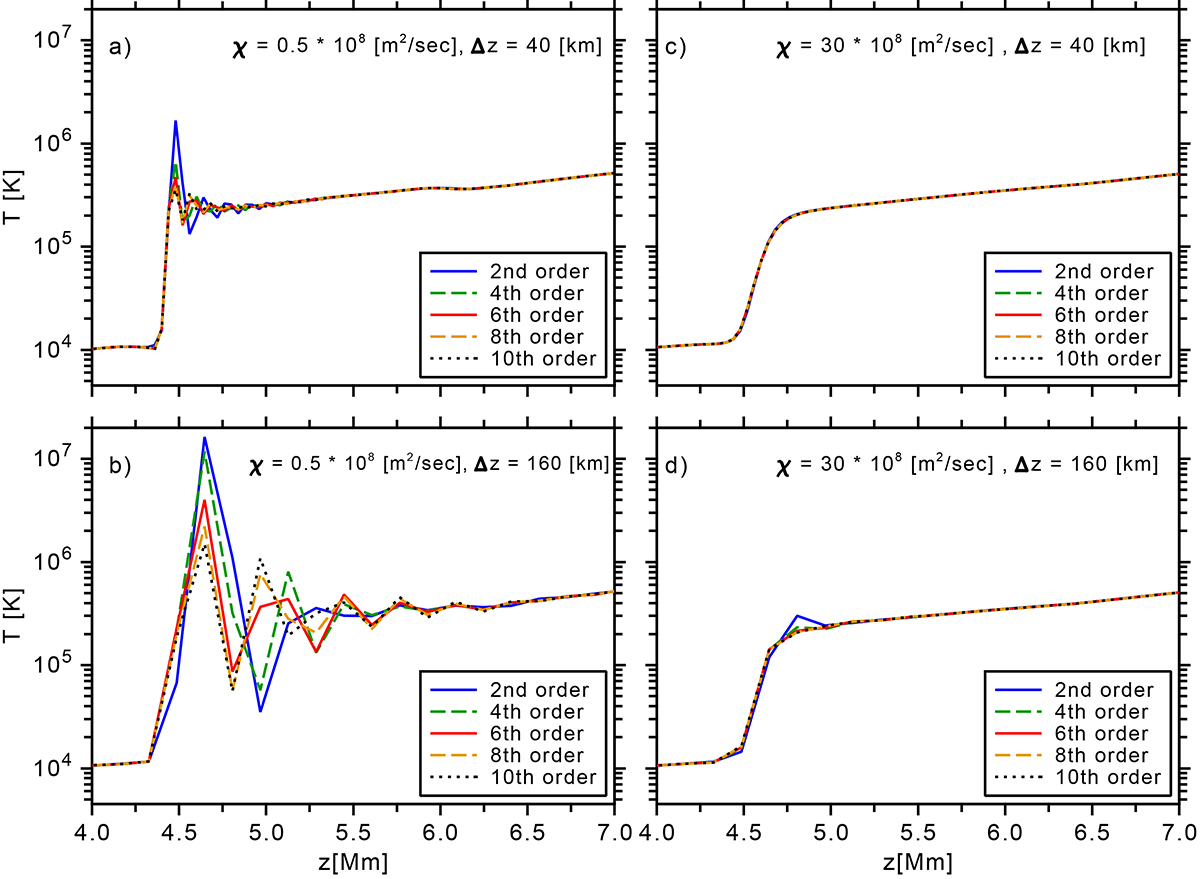
Temperature profiles of different order numerical schemes for varying heat-conduction coefficients, χ, and grid resolutions, Δz, at the same physical time, t = 300 s, in the simulation. The horizontal axes indicate the atmospheric height, z. The solid blue line represents the run with the second-order numerical scheme, the dashed green and orange lines the fourth- and the eighth-order runs, respectively, and the dotted black lines the tenth-order runs. The solid red line represents the sixth-order derivative numerical scheme, which was the chosen numerical scheme for our simulation. Panels c and d show the results for a heat conduction of χ = 30 − 108 m2/s, and panels a and d the results for a heat conduction of χ = 0.5 − 108 m2/s.
Current usage metrics show cumulative count of Article Views (full-text article views including HTML views, PDF and ePub downloads, according to the available data) and Abstracts Views on Vision4Press platform.
Data correspond to usage on the plateform after 2015. The current usage metrics is available 48-96 hours after online publication and is updated daily on week days.
Initial download of the metrics may take a while.