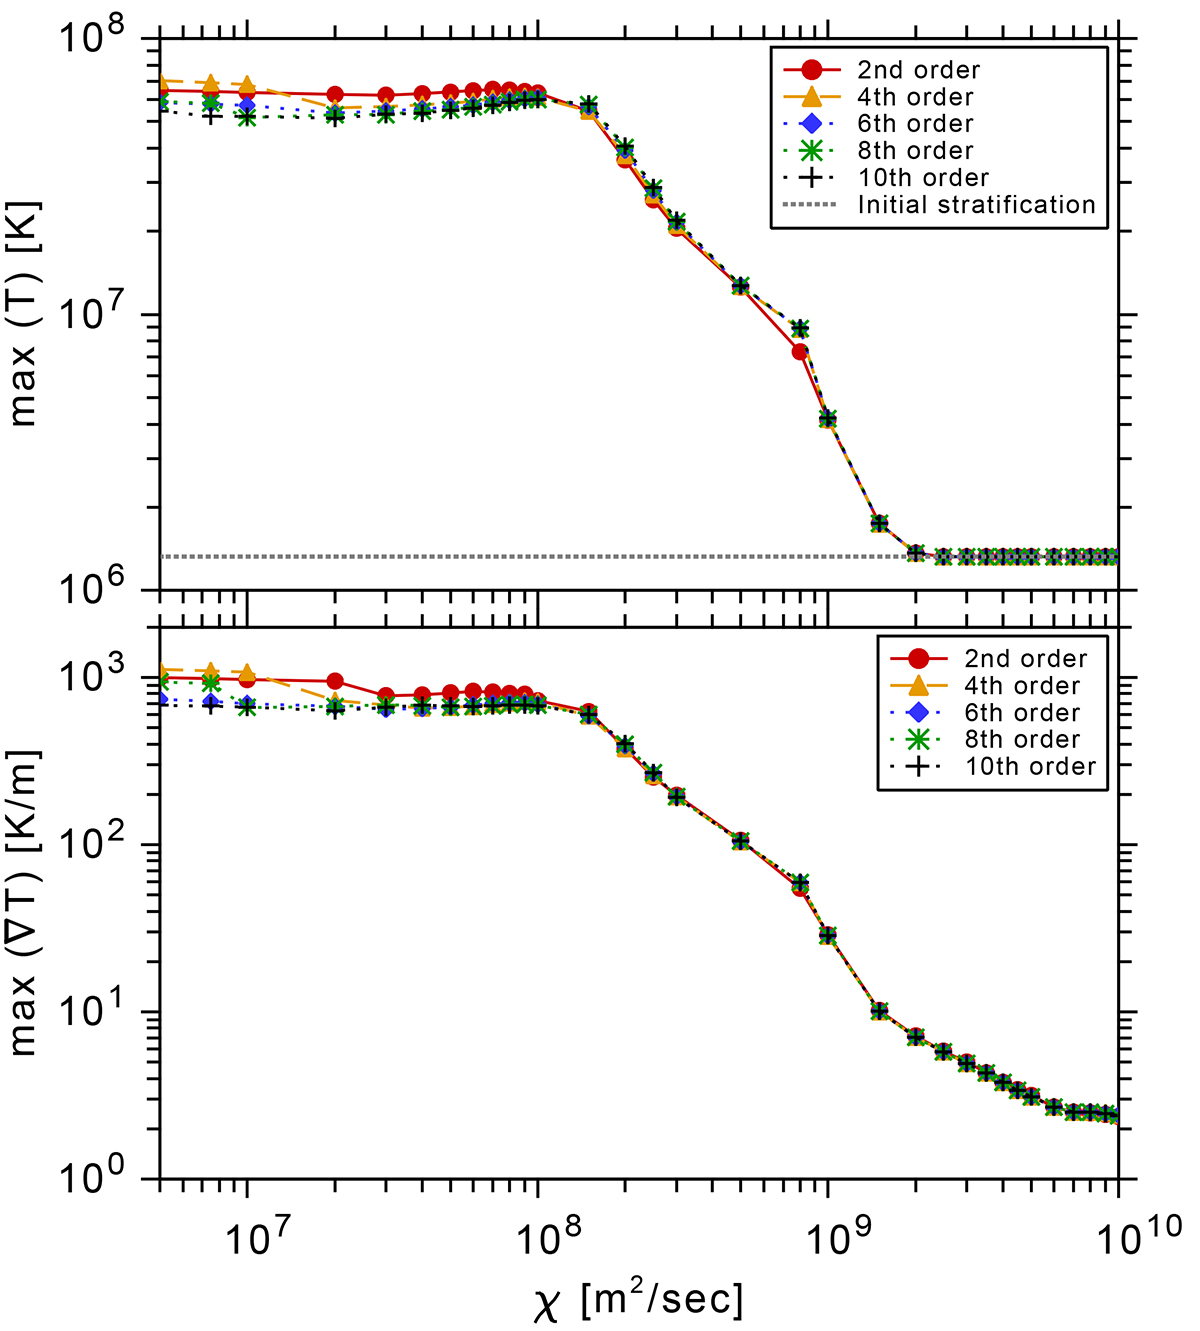
Fig. 6.
Download original image
Parametric study for χ vs maximum temperature (above) and χ vs the gradient of maximum temperature (below) for different orders of the numerical scheme. In both plots, each marker corresponds to a numerical scheme: red circles (solid line) represent the second-order scheme, orange triangles (solid line) the fourth-order, blue diamonds (dotted line) the sixth-order, green stars (dotted line) the eighth-order, and black crosses (dotted line) the tenth-order. The x-axis shows the χ parameter over a range of five orders of magnitude. The maximum temperature and the gradient of maximum temperature have been taken at 300 seconds for all the runs. The blue diamond markers represent the same data as the blue curve in Fig. 5.
Current usage metrics show cumulative count of Article Views (full-text article views including HTML views, PDF and ePub downloads, according to the available data) and Abstracts Views on Vision4Press platform.
Data correspond to usage on the plateform after 2015. The current usage metrics is available 48-96 hours after online publication and is updated daily on week days.
Initial download of the metrics may take a while.