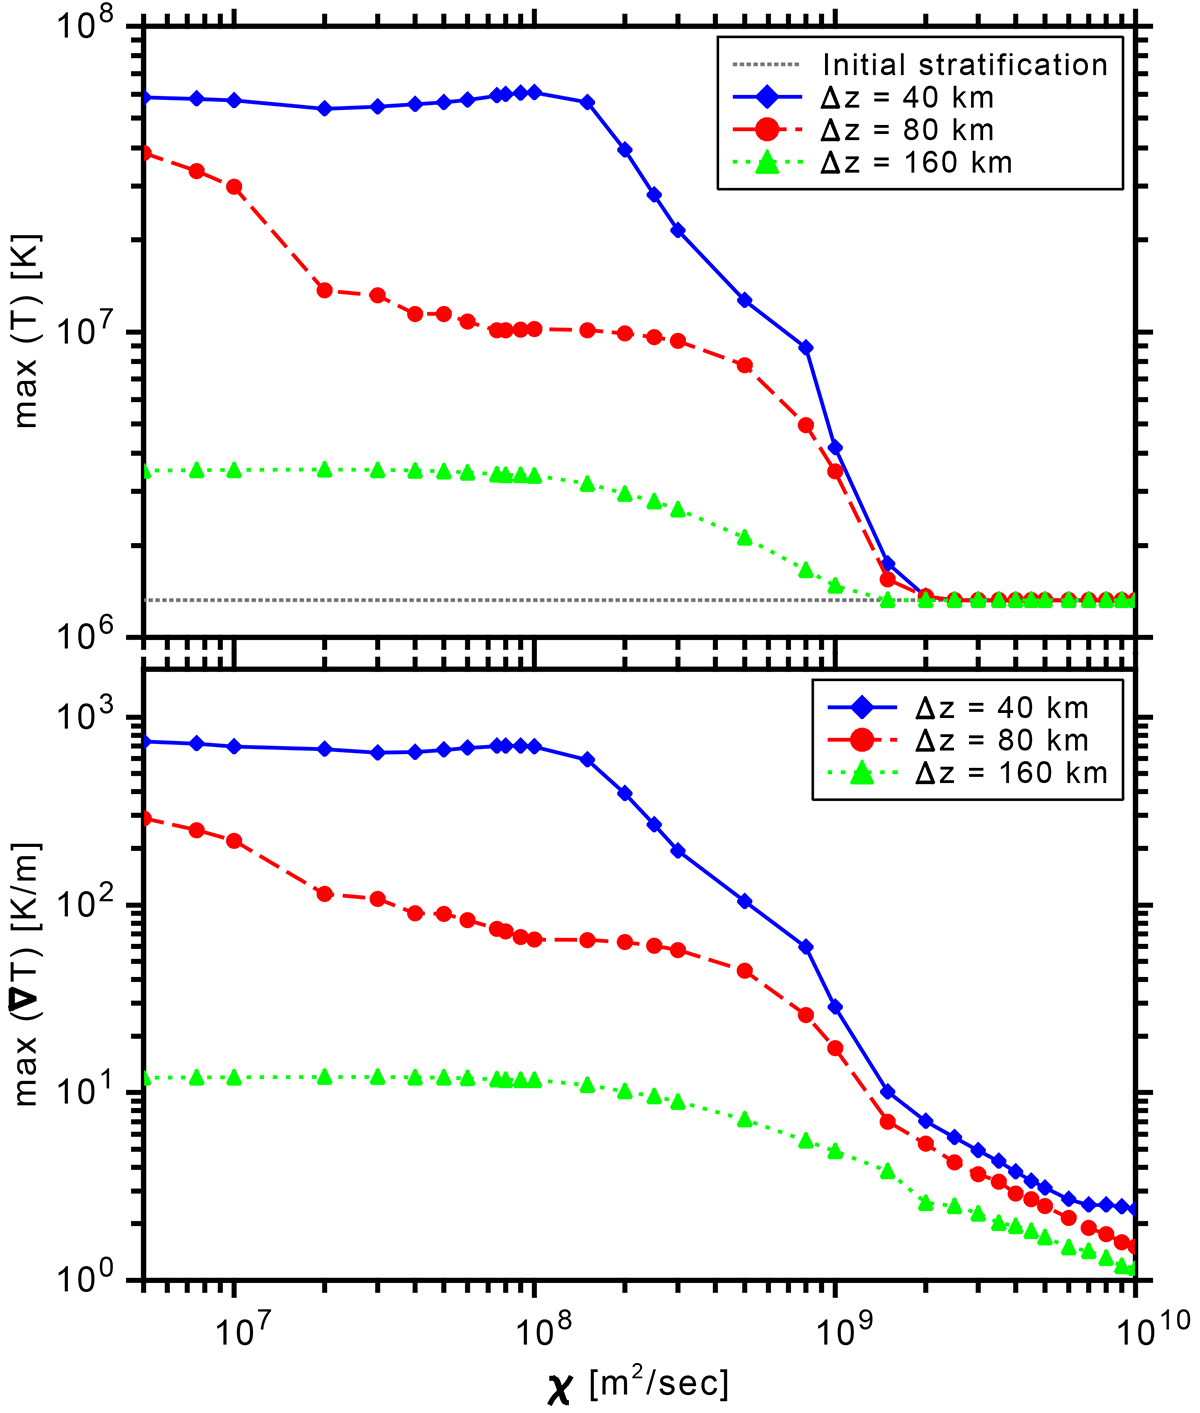
Fig. 5.
Download original image
Parametric study for χ vs maximum temperature (above) and χ vs the gradient of maximum temperature (below) for three different resolutions. In both plots, each triangle in the dotted green line represents the runs with a grid distance of 160 km, dots in the dashed red line 80 km, and diamonds in the solid blue line 40 km. The maximum temperature and the gradient of maximum temperature have been taken at 300 seconds for all the runs. The dotted grey line shows the maximum temperature for the reference atmospheric stratification, which is the same for all the runs. The x-axis shows the χ parameter over a range of five orders of magnitude.
Current usage metrics show cumulative count of Article Views (full-text article views including HTML views, PDF and ePub downloads, according to the available data) and Abstracts Views on Vision4Press platform.
Data correspond to usage on the plateform after 2015. The current usage metrics is available 48-96 hours after online publication and is updated daily on week days.
Initial download of the metrics may take a while.