Fig. 4.
Download original image
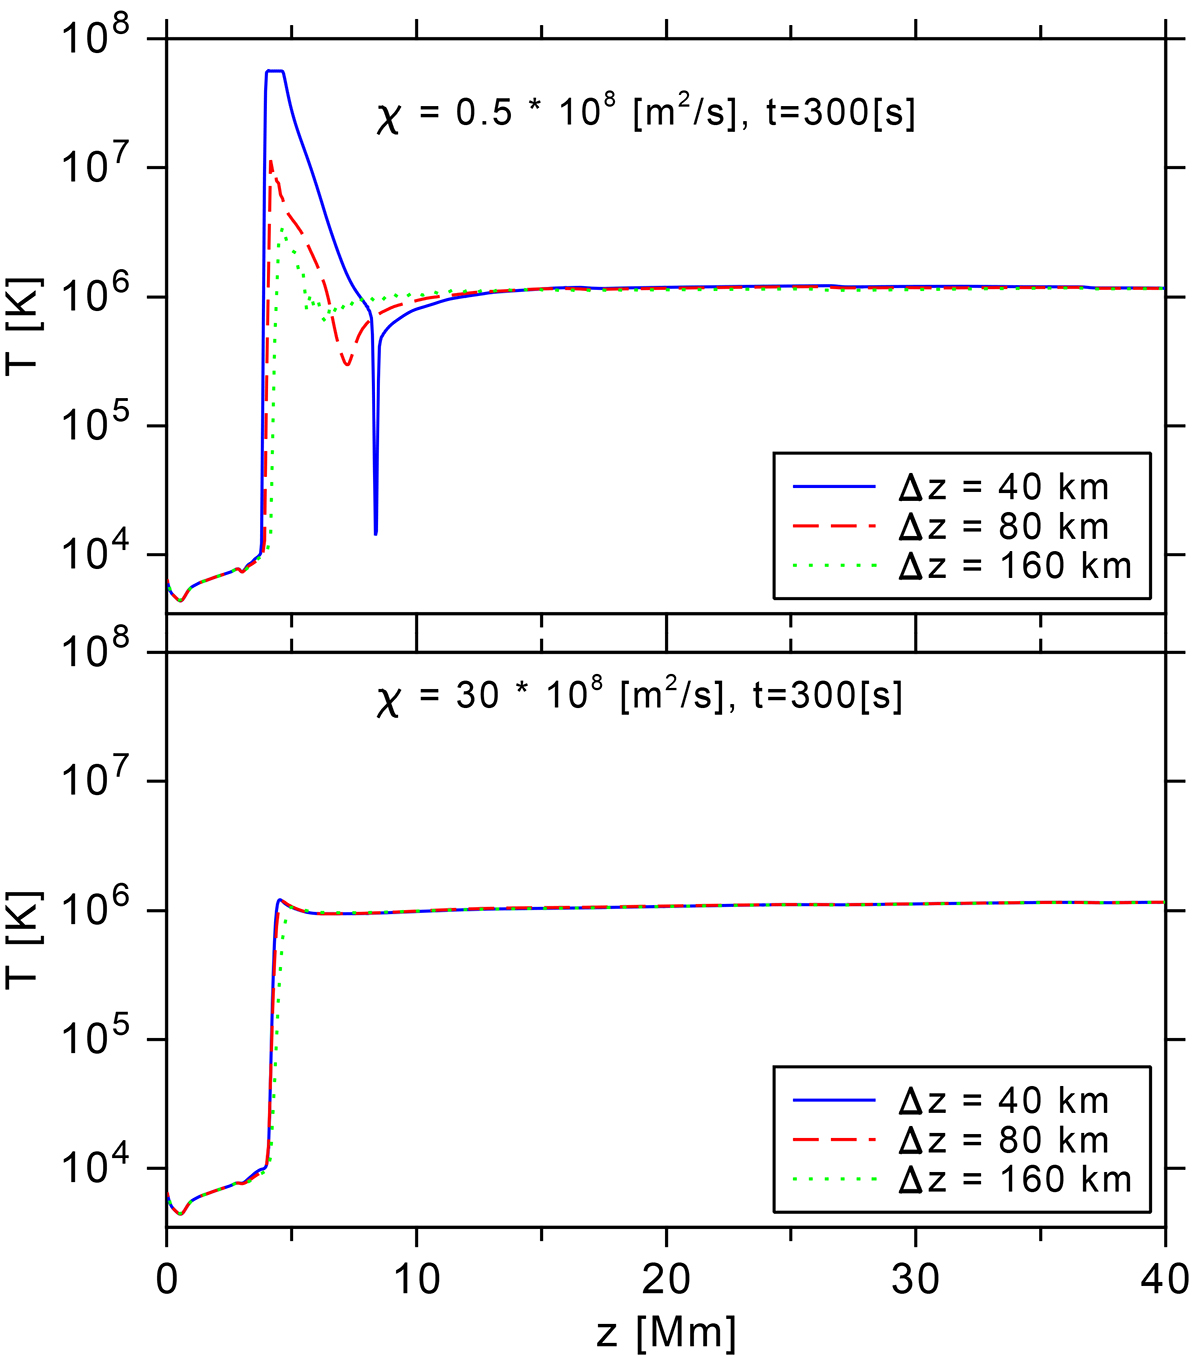
Temperature profiles for three different grid resolutions and two different heat-conduction coefficients, χ. The solid blue lines show a grid distance of 40 km, dashed red lines 80 km, and dotted green lines 160 km. The horizontal axes indicate the atmospheric height, z. The upper panel shows the results for heat conduction of χ = 0.5 × 10⁸ m2/s, and the lower panel χ = 30 × 108 m2/s.
Current usage metrics show cumulative count of Article Views (full-text article views including HTML views, PDF and ePub downloads, according to the available data) and Abstracts Views on Vision4Press platform.
Data correspond to usage on the plateform after 2015. The current usage metrics is available 48-96 hours after online publication and is updated daily on week days.
Initial download of the metrics may take a while.