Open Access
Fig. 3.
Download original image
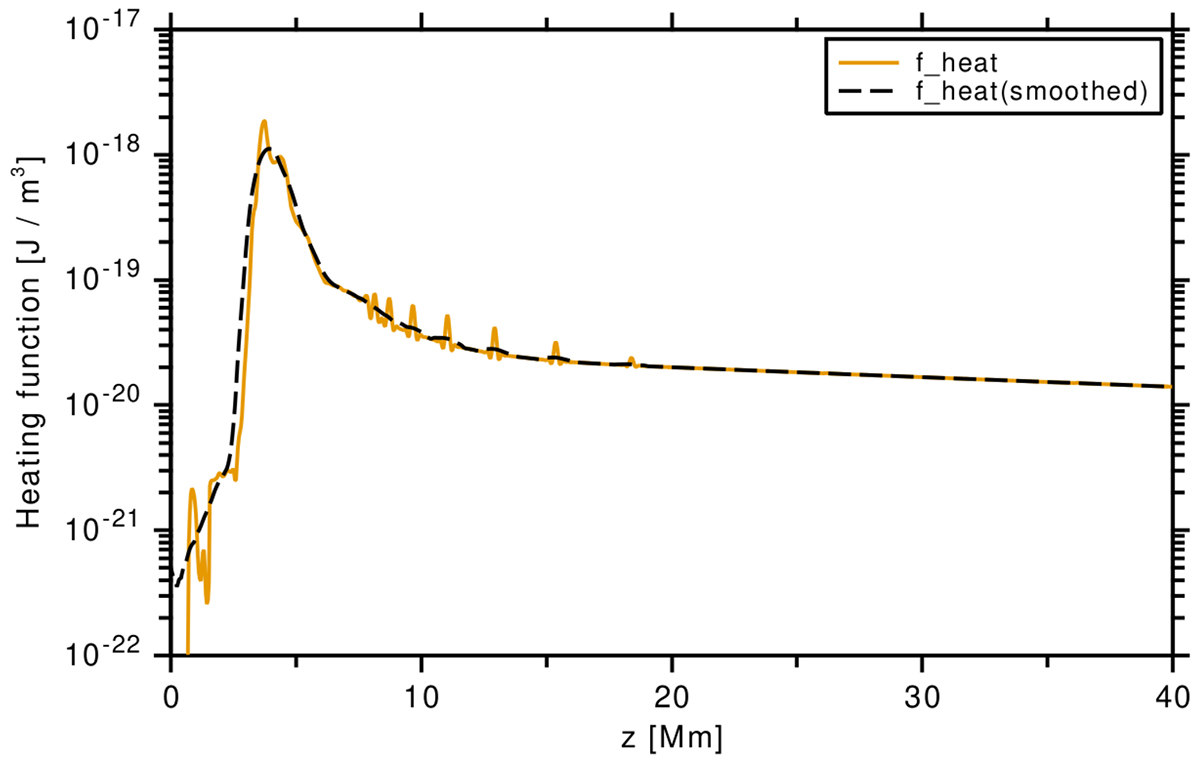
Vertical profile of our artificial heating function. The solid yellow line denotes the sum of all coronal energy loss terms, computed from the initial atmospheric stratification. The dotted black line shows a Gaussian-convolution smoothing applied to the initial energy losses.
Current usage metrics show cumulative count of Article Views (full-text article views including HTML views, PDF and ePub downloads, according to the available data) and Abstracts Views on Vision4Press platform.
Data correspond to usage on the plateform after 2015. The current usage metrics is available 48-96 hours after online publication and is updated daily on week days.
Initial download of the metrics may take a while.