Fig. 6
Download original image
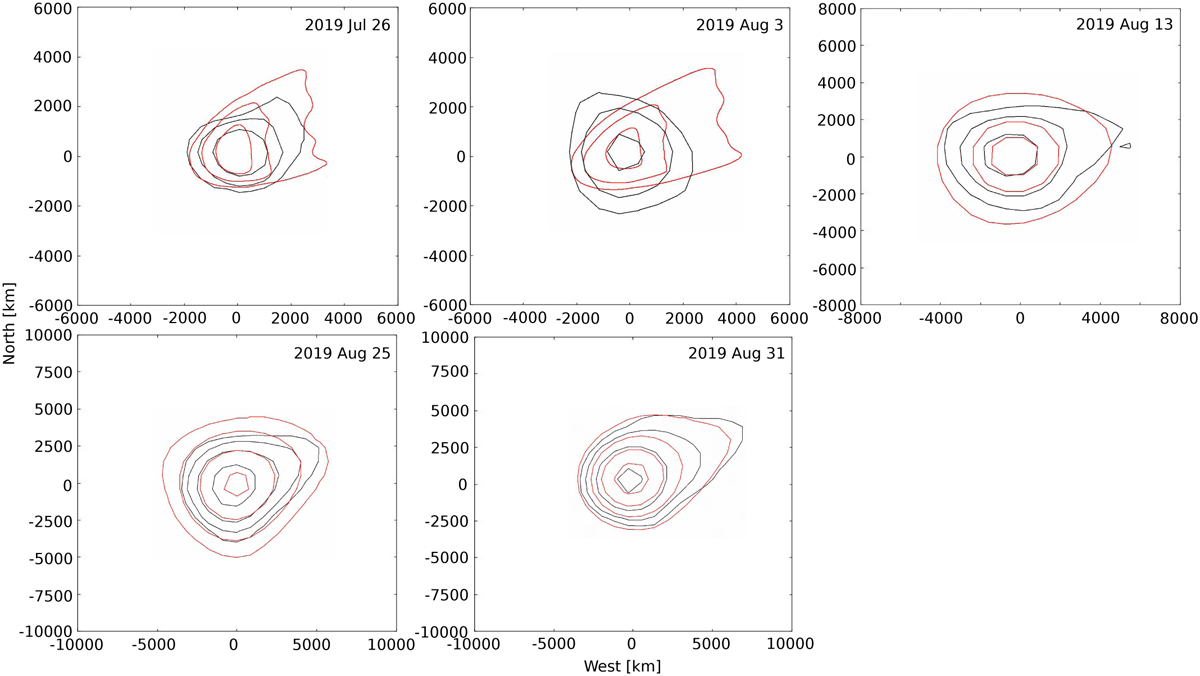
Comparison between brightness contours in observed images (black lines) and modeled images (red lines, using the parameters in Table 3) from July 26 to August 31, 2019. The brightness levels corresponding to the innermost contours in the images for each of the five dates are 23.83 mag arcsec−2, 23.11 mag arcsec−2, 22.99 mag arcsec−2, 22.39 mag arcsec−2, and 22.29 mag arcsec−2, respectively. For adjacent contours, the brightness level of the outer brightness contour is half that of the inner brightness contour. The same step (logarithmically) is adopted for both observed and modeled images.
Current usage metrics show cumulative count of Article Views (full-text article views including HTML views, PDF and ePub downloads, according to the available data) and Abstracts Views on Vision4Press platform.
Data correspond to usage on the plateform after 2015. The current usage metrics is available 48-96 hours after online publication and is updated daily on week days.
Initial download of the metrics may take a while.