Open Access
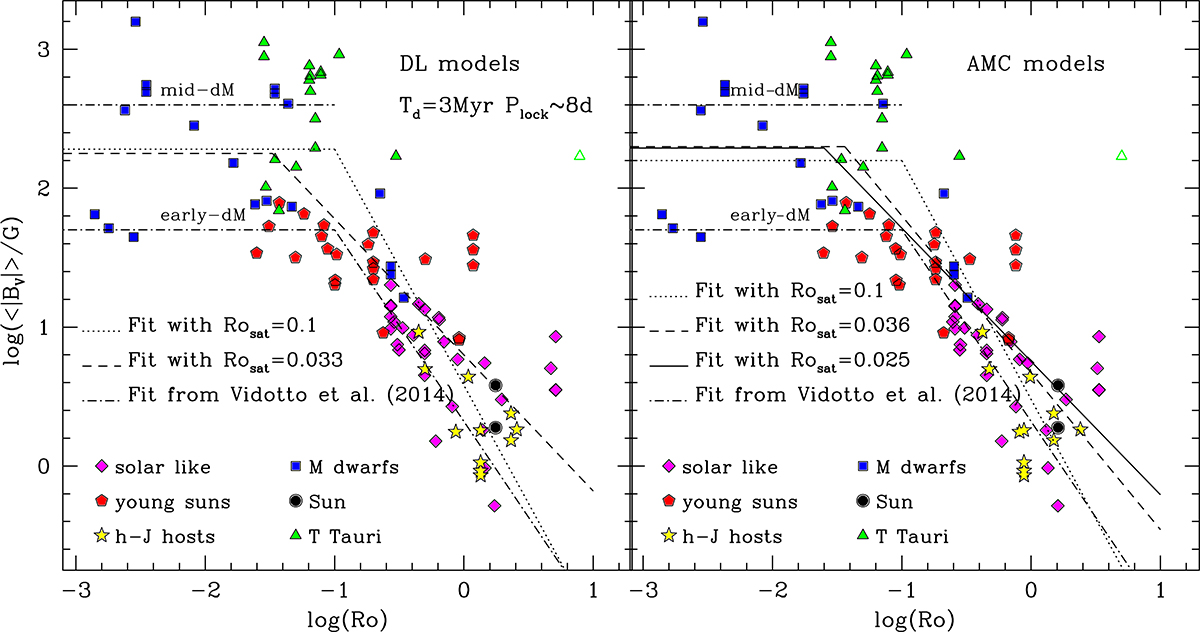
Fig. 9.
Download original image
log(⟨|BV|⟩) × log(Ro) for stars in the sample of Vidotto et al. (2014). In the left panel, the τc values, which enter in Ro calculations, were obtained from DL models with Plock ∼ 8 days and Tdisk = 3 Myr. In the right panel, τc values were obtained from AMC models. Symbols are the same as in Fig. 8.
Current usage metrics show cumulative count of Article Views (full-text article views including HTML views, PDF and ePub downloads, according to the available data) and Abstracts Views on Vision4Press platform.
Data correspond to usage on the plateform after 2015. The current usage metrics is available 48-96 hours after online publication and is updated daily on week days.
Initial download of the metrics may take a while.