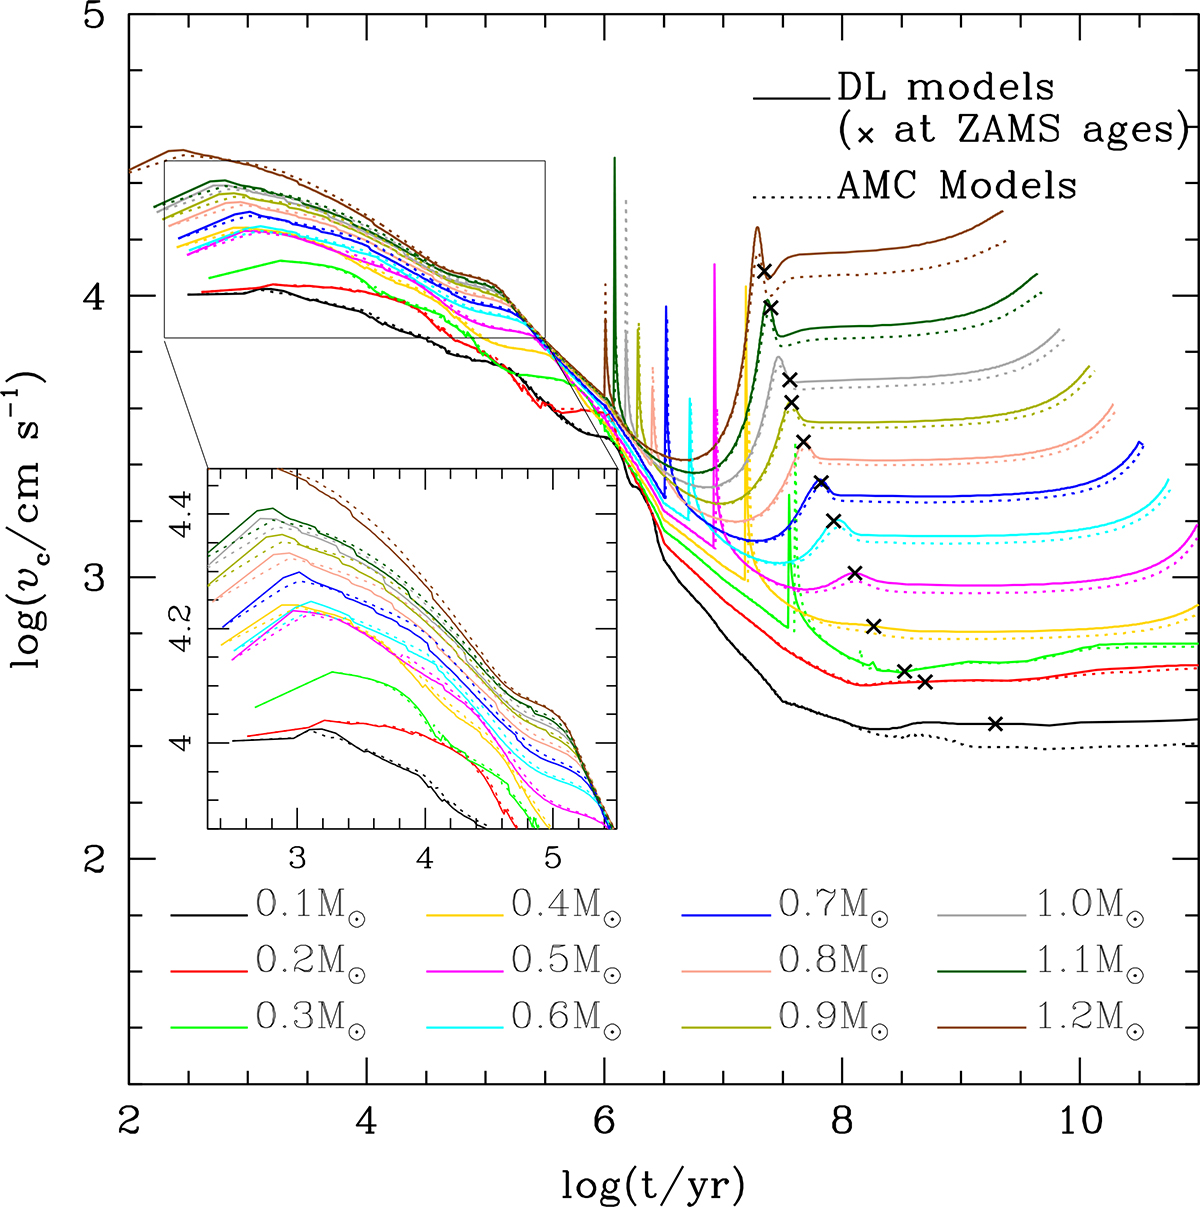
Fig. 1.
Download original image
Convective velocity as a function of age for different sets of models (DL models are drawn in solid lines and AMC models are shown in dotted lines). The curves referring to each stellar mass are drawn in a different colour according to the legend. Crosses (×) show the ZAMS ages for each mass model. The inset shows in detail the temporal evolution of vc during the beginning of the pre-MS phase.
Current usage metrics show cumulative count of Article Views (full-text article views including HTML views, PDF and ePub downloads, according to the available data) and Abstracts Views on Vision4Press platform.
Data correspond to usage on the plateform after 2015. The current usage metrics is available 48-96 hours after online publication and is updated daily on week days.
Initial download of the metrics may take a while.