Fig. 3.
Download original image
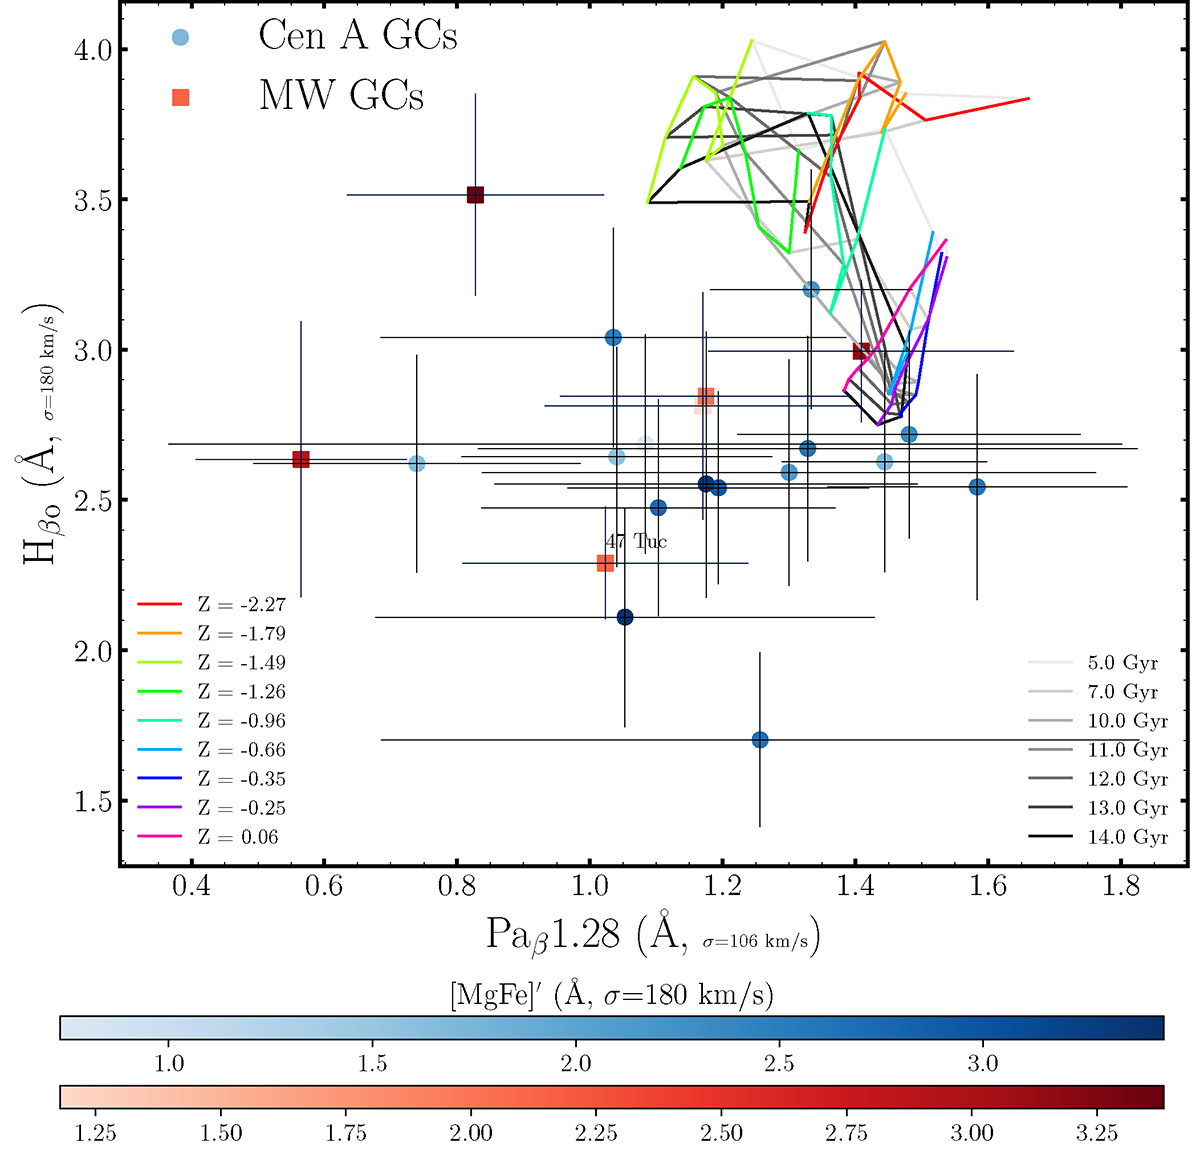
Hβo vs Paβ1.28 line strengths in GCs from the Cen A galaxy and the MW. In this plot, Cen A GCs are represented by filled circles and MW GCs by filled squares. The line strengths are plotted against the [MgFe]′ metallicity indicator, with a bluish colour bar denoting the [MgFe]′ values for Cen A GCs and a reddish colour bar for MW GCs. The overlaid grid shows the predictions of the E–MILES model with BaSTI isochrones. The model grid displays predictions across a range of metallicities for the distinct ages specified in the legend.
Current usage metrics show cumulative count of Article Views (full-text article views including HTML views, PDF and ePub downloads, according to the available data) and Abstracts Views on Vision4Press platform.
Data correspond to usage on the plateform after 2015. The current usage metrics is available 48-96 hours after online publication and is updated daily on week days.
Initial download of the metrics may take a while.