Fig. 2.
Download original image
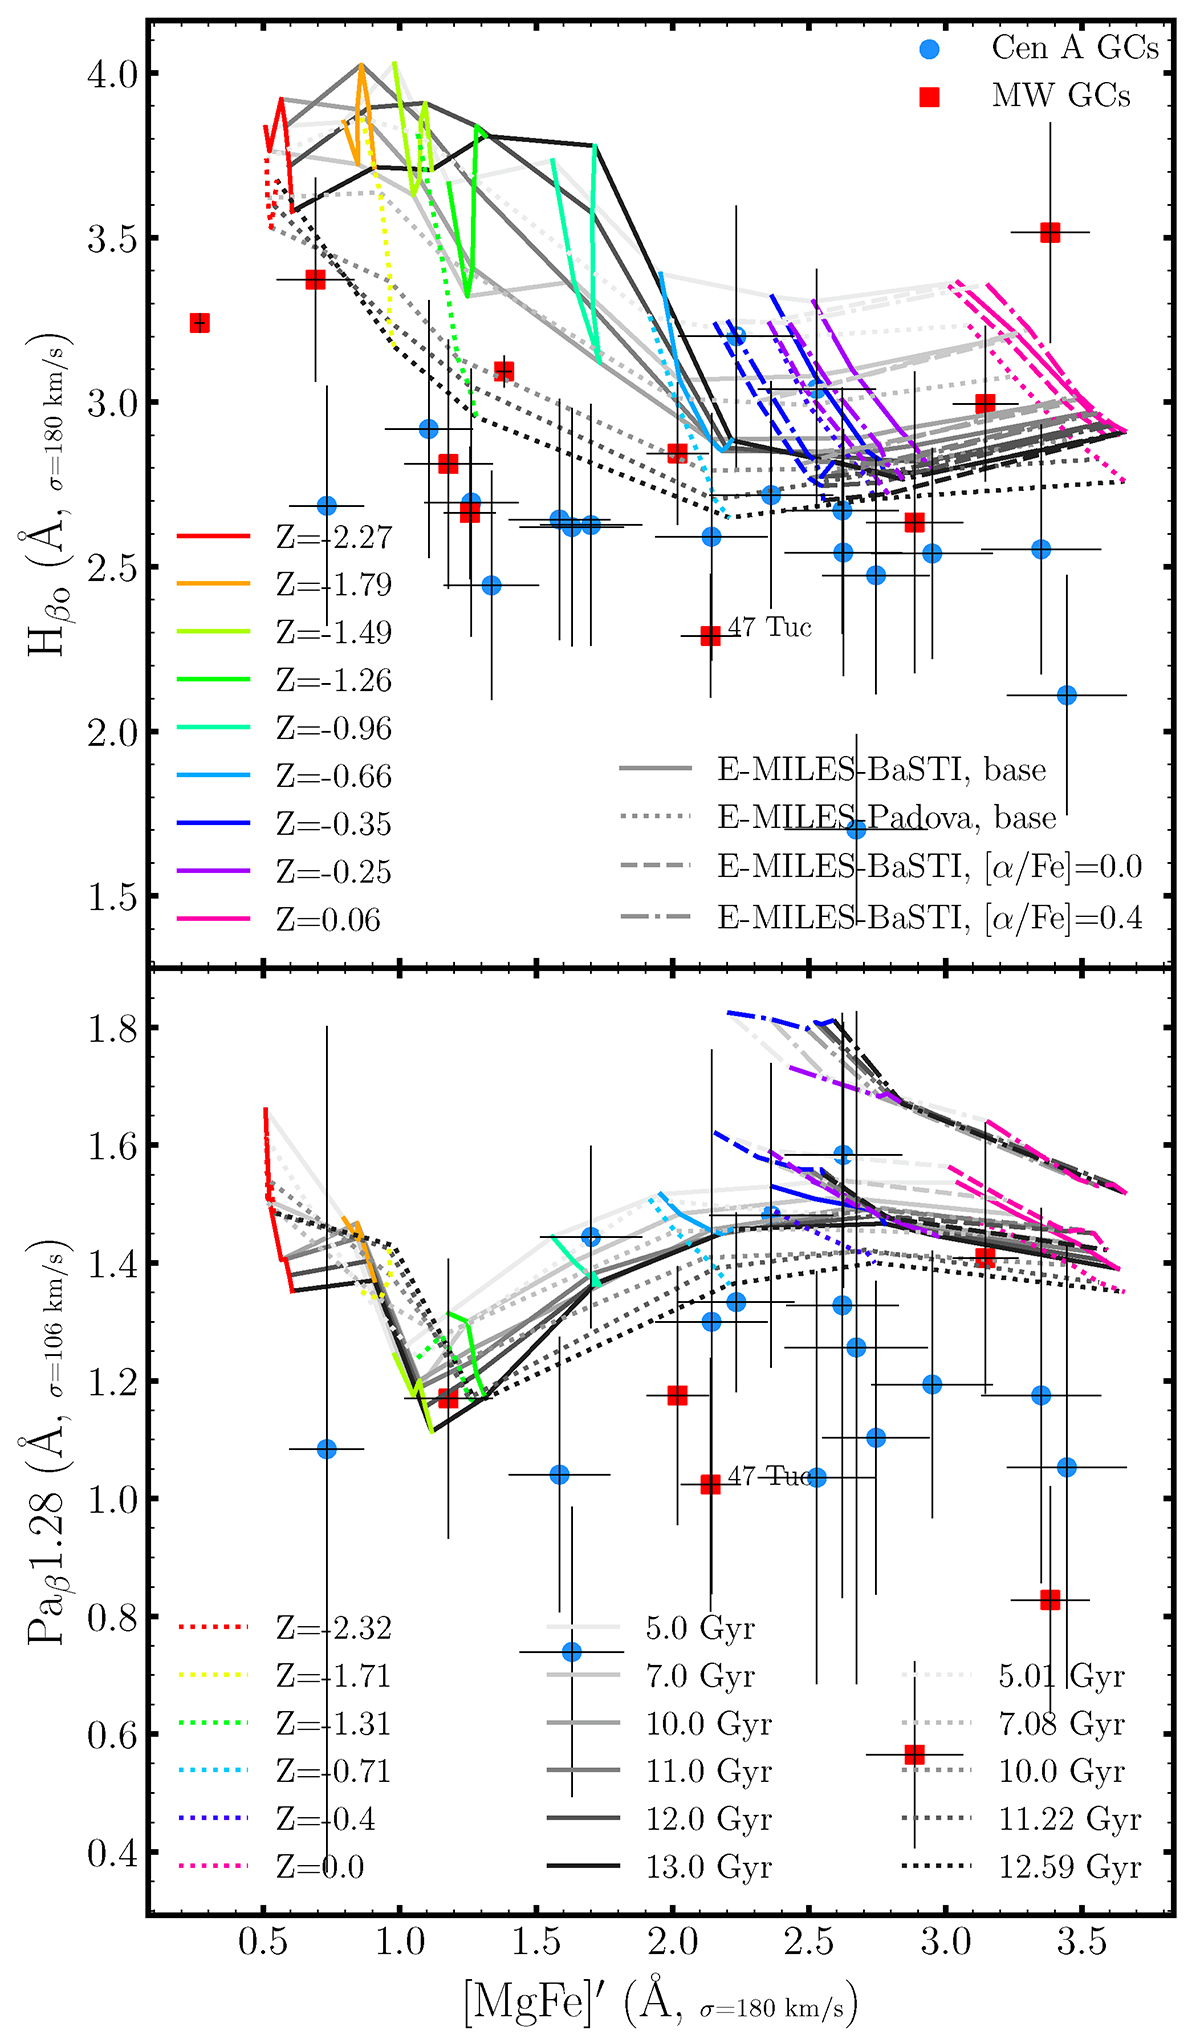
Line strengths of two hydrogen line indices, Hβo in the optical (upper panel) and Paβ1.28 in the NIR (lower panel), plotted against the total metallicity indicator [MgFe]′ for two samples of GCs in the Cen A galaxy (blue points) and MW (red squares). The overlaid grids represent predictions from updated E–MILES SSP models with BaSTI and Padova isochrones (solid and dotted lines), as well as E–MILES SSPs with [α/Fe] = 0.0 and +0.4 (dashed and dash-dotted lines). These models span a range of metallicities from Z = −2.27 (−2.32) to solar, as indicated by various colours, and ages ranging from 5 to 13 Gyr (12.59 Gyr) for SSPs with BaSTI (Padova) isochrones.
Current usage metrics show cumulative count of Article Views (full-text article views including HTML views, PDF and ePub downloads, according to the available data) and Abstracts Views on Vision4Press platform.
Data correspond to usage on the plateform after 2015. The current usage metrics is available 48-96 hours after online publication and is updated daily on week days.
Initial download of the metrics may take a while.