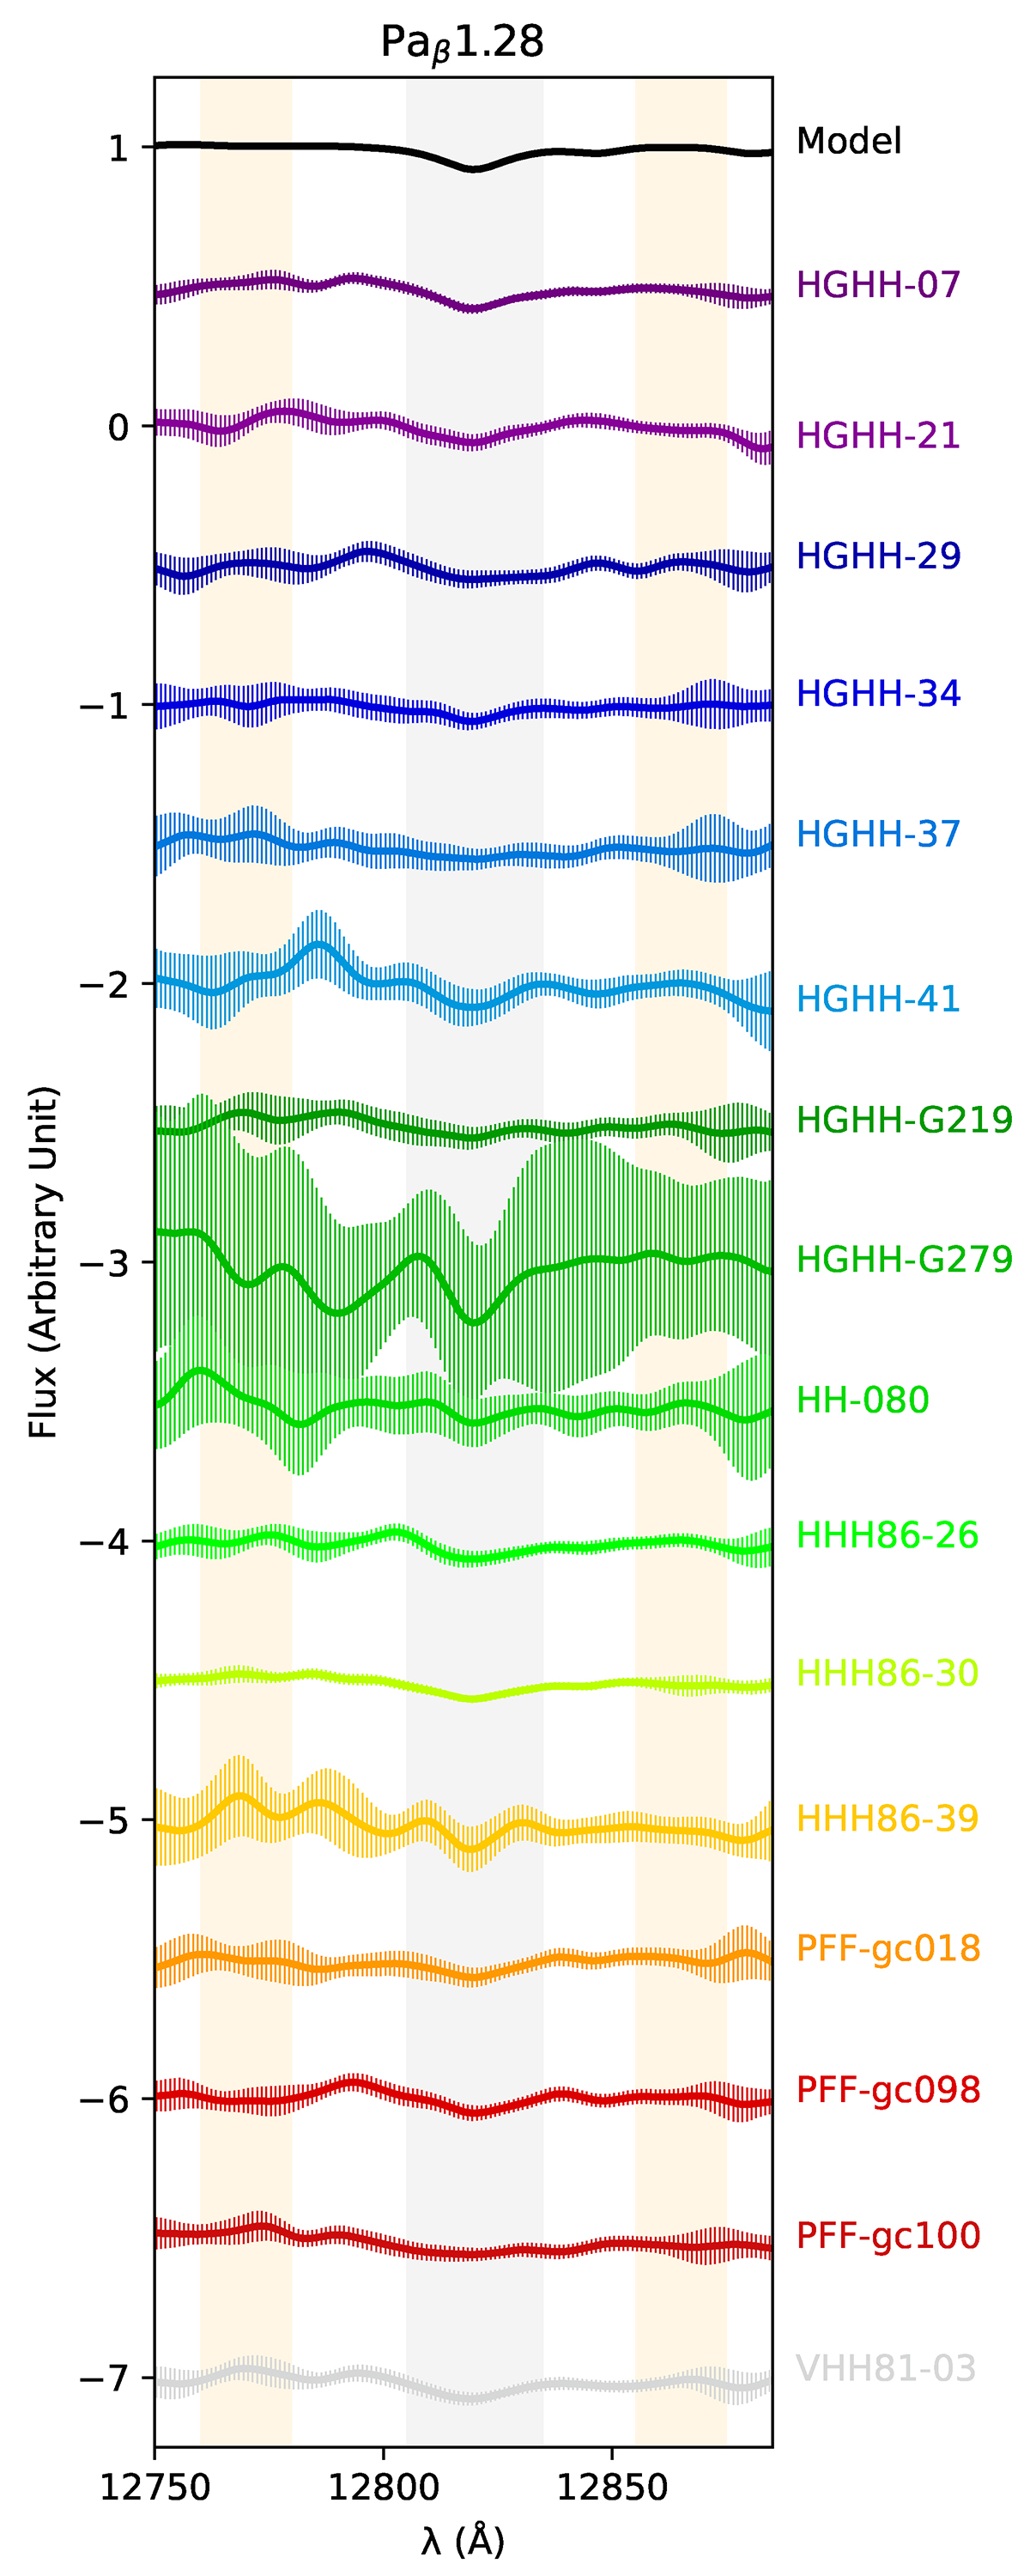
Fig. 1.
Download original image
Spectra of Cen A GCs in the region of the Paβ1.28 index. All spectra are presented in the rest frame and have been smoothed to a resolution of 106 km s−1. Error bars are shown as vertical lines for all spectra. The black spectrum on top represents the E–MILES SSP of age 11 Gyr, at Z = −0.66, with a Kroupa-like IMF. The central bandpass of the Paβ1.28 index, along with the blue and red pseudo-continua, are highlighted as grey and orange areas, respectively. These bandpasses are based on Eftekhari et al. (2021), with the central bandpass narrowed to 12 805–12 835 Å to avoid spectral artifacts within the index.
Current usage metrics show cumulative count of Article Views (full-text article views including HTML views, PDF and ePub downloads, according to the available data) and Abstracts Views on Vision4Press platform.
Data correspond to usage on the plateform after 2015. The current usage metrics is available 48-96 hours after online publication and is updated daily on week days.
Initial download of the metrics may take a while.