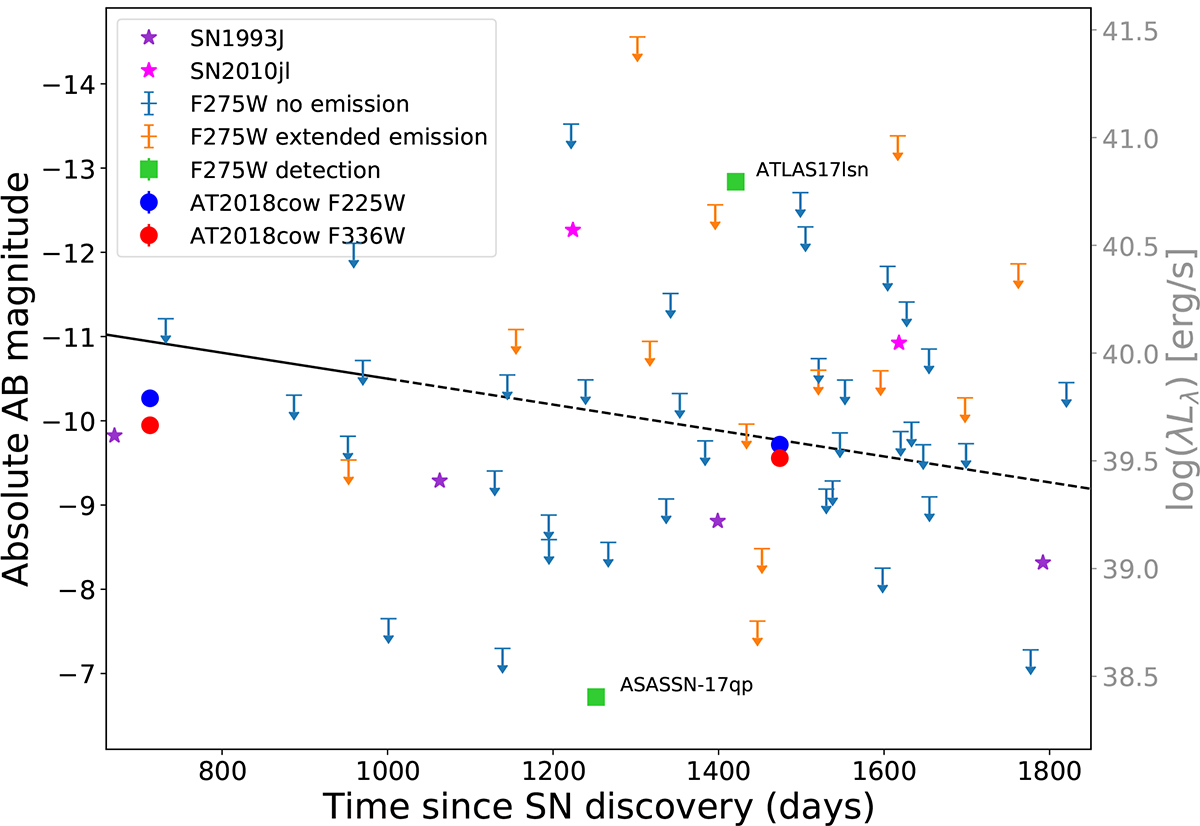
Fig. 2.
Download original image
Brightness of our sample of SNe versus time since discovery. The light curve of AT2018cow from Inkenhaag et al. (2023) at late times is plotted as well for comparison with circular markers in blue (F225W) and red (F336W). The black line represent the late time UV (UVW2-filter) brightness of the model with CSM interaction from Dessart et al. (2023), and the dashed line is the model extrapolated with the same decay rate for the duration of our observations. The light blue arrows represent upper limits to SNe emission determined close to/at the position of the SN, while orange arrows represent upper limits to SNe where there is extended emission close to/at the position of the SN. Light green squares indicate the magnitude of the detection of a point source in the UV at late times at a position consistent with that of the SN. They are labelled with the corresponding SN name and the error on the magnitude is smaller than the marker size. The magenta and purple stars are synthetic photometric measurements of SN2010jl and SN1993J, respectively, see the main text for details on how these were obtained. On the right axis, we have added the shock luminosity of the SN in erg s−1 corresponding to the absolute magnitude on the left axis for clarity.
Current usage metrics show cumulative count of Article Views (full-text article views including HTML views, PDF and ePub downloads, according to the available data) and Abstracts Views on Vision4Press platform.
Data correspond to usage on the plateform after 2015. The current usage metrics is available 48-96 hours after online publication and is updated daily on week days.
Initial download of the metrics may take a while.