Open Access
Fig. 9
Download original image
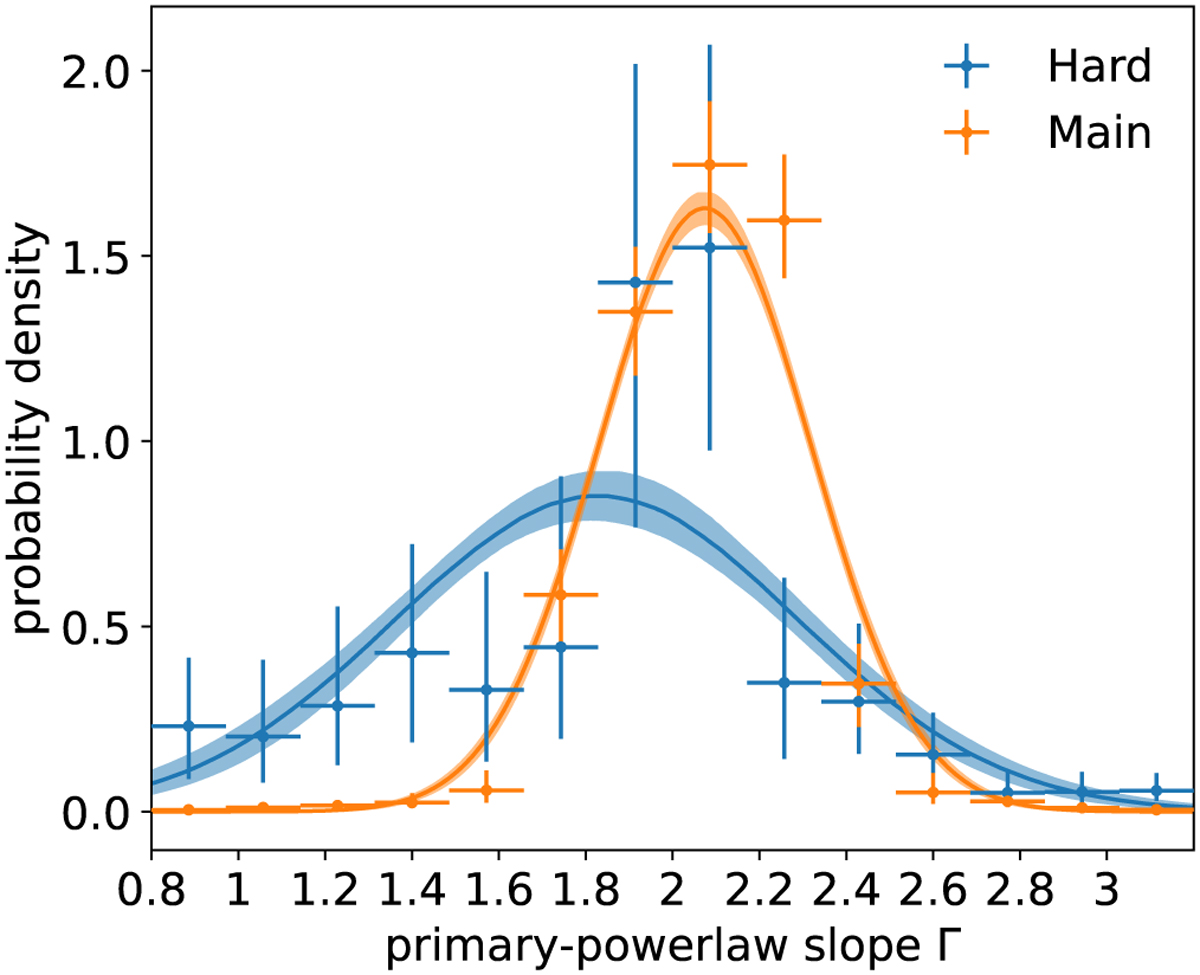
Distributions of the primary power-law slope in the ‘power law plus blackbody’ model (m3) for the hard (blue) and main (orange) AGN sample. The distributions were obtained using the HBM method adopting histogram (points with 1σ error bars) and a Gaussian model (lines with a 1σ range).
Current usage metrics show cumulative count of Article Views (full-text article views including HTML views, PDF and ePub downloads, according to the available data) and Abstracts Views on Vision4Press platform.
Data correspond to usage on the plateform after 2015. The current usage metrics is available 48-96 hours after online publication and is updated daily on week days.
Initial download of the metrics may take a while.